- Bitcoin Cash is trading down a whopping 7% on Thursday, as bears resume selling pressure falling short breather.
- BCH/USD price action is moving within steep descending channel formation.
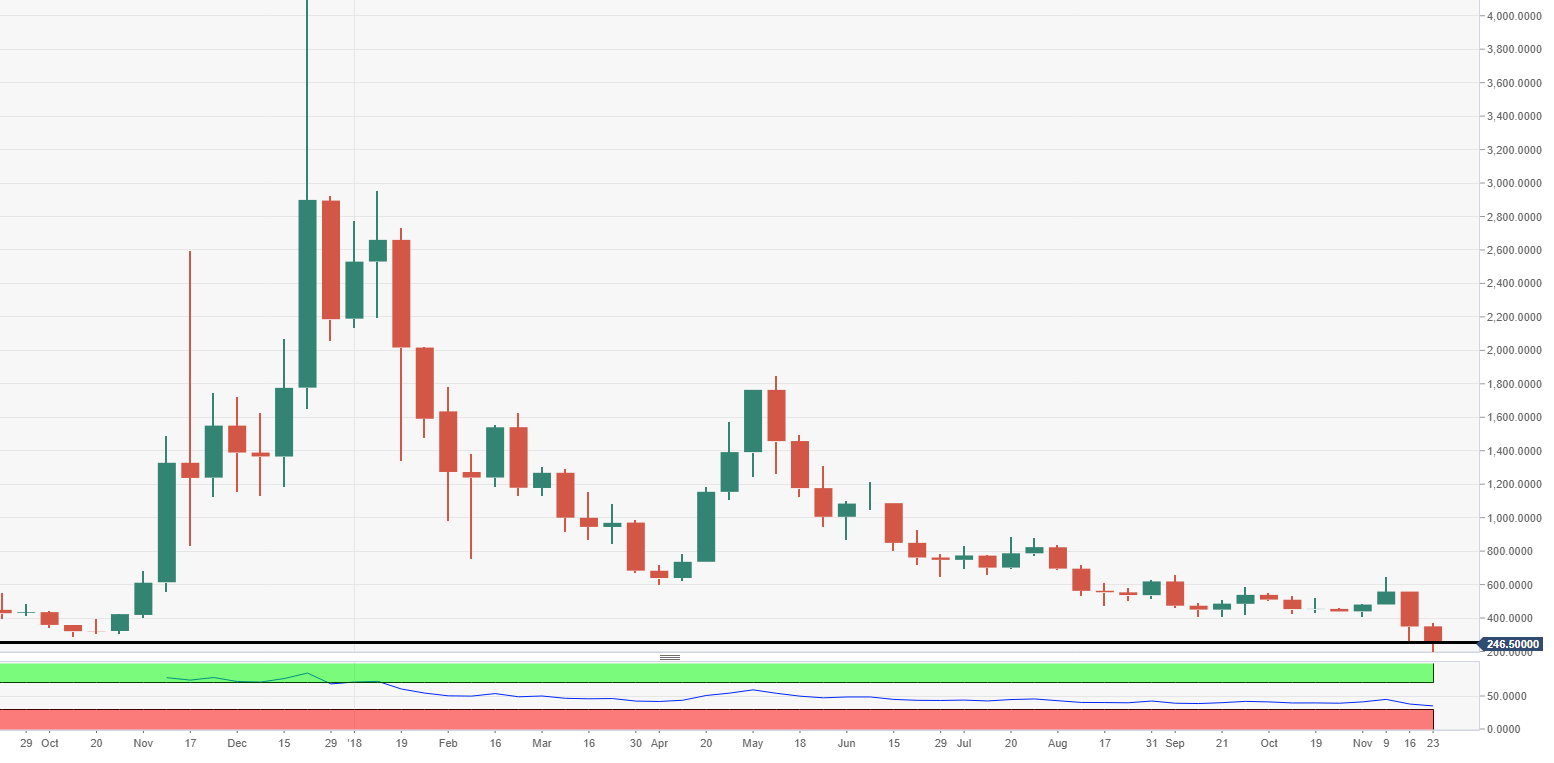
- Weekly chart view remains bearish, second consecutive week of losses. RSI still not within oversold territory. Price moving into the abyss, uncharted territory with current downward trend.
BCH/USD 60-minute chart
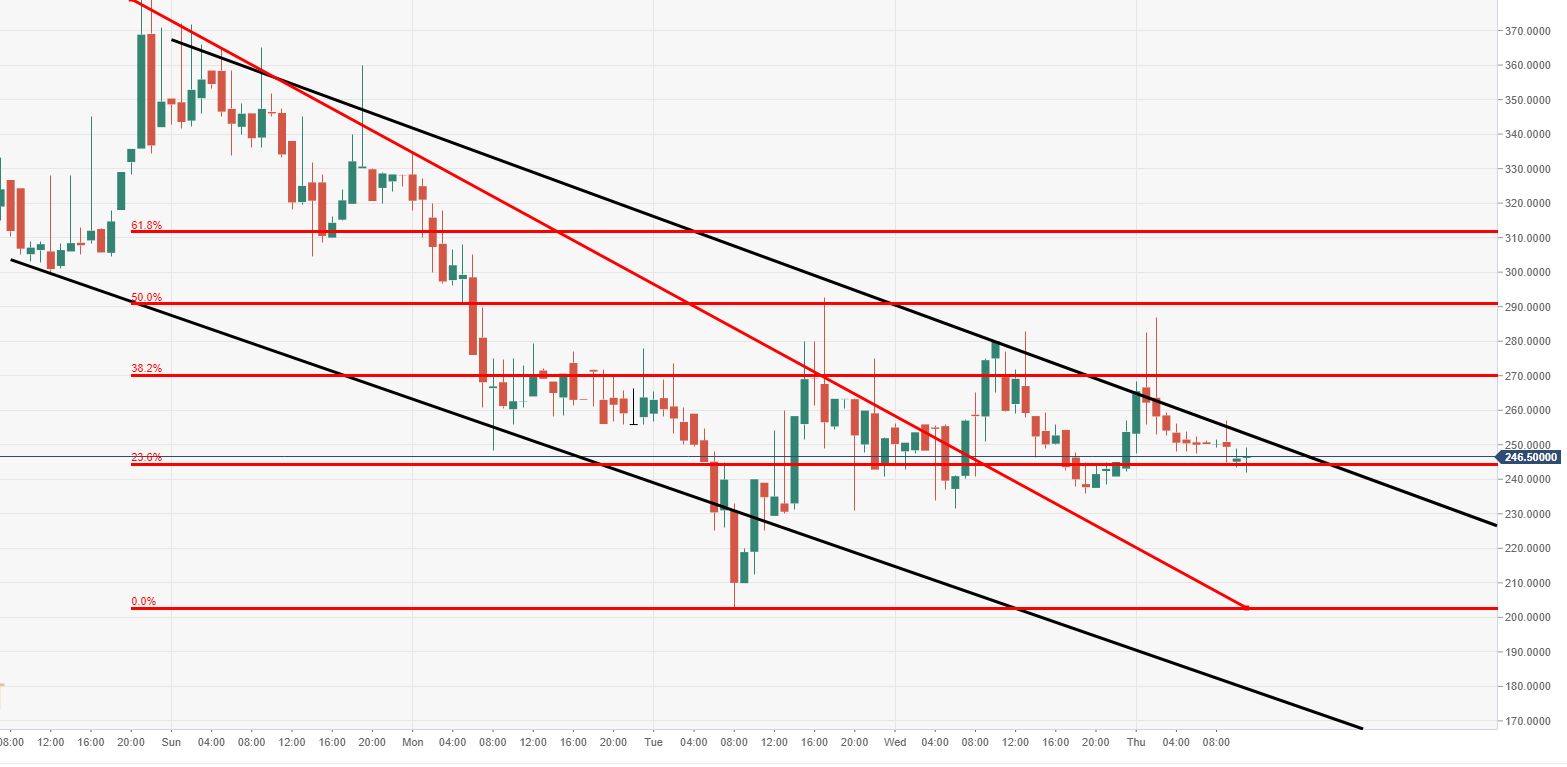
Spot rate: 246.5
Relative change: -5.82%
High: 286.7
Low: 242.1
Trend: Bearish
Support 1: 244.0, 23.6% Fibonacci.
Support 2: 202.4, 20th November low.
Support 3: 200.0, psychological support.
Resistance 1: 254.2, upper part of channel.
Resistance 2: 270.4, 38.2% Fibonacci.
Resistance 3: 291.3, 50% Fibonacci.
BCH/USD weekly chart
- Price running at second straight week of steep losses, with further downside as a strong possibility as price is not oversold via the weekly view.