- Bitcoin Cash price ignores market bullish trend to record a 3.3% loss on the day.
- BCH/USD upside is limited below the trendline resistance.
- Technical indicators point towards continued bear trend in the short-term.
Bitcoin Cash continues to find balance following the hard fork that shook the network leading a split of the chain. The price plunged massively recording losses in the excess of 76% in less than two weeks. At the moment, BCH/USD is changing at $152.23 and appears to have found a bottom at $145. Investors are regaining confidence in the crypto after the hard fork. However, it is evident that a recovery will be a big task for the buyers.
The price is currently motionless below the moving averages. Besides, the 100 SMA has crossed beneath the 200 SMA to indicate that seller influence is still on the rise. BCH/USD is down 3.3% on Tuesday, contrary to the recovery trend shown by Bitcoin which is trading in the green. Ethereum and Ripple are also correcting higher, although marginally.
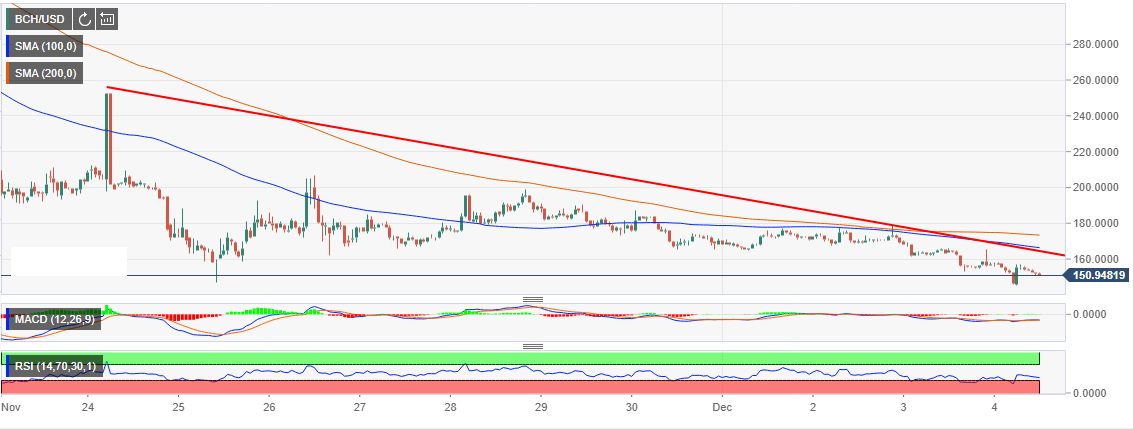
The applied technical indicators on the chart confirm the bearish trend in the short-term. The relative strength index (RSI) has changed direction south and is likely to slide into the oversold zone for the second time today. The MACD momentum indicator signal is stuck in the negative region and is horizontal. This means that BCH/USD is primed for sideways movement. The primary support for the asset is at $145. On the upside, the descending trendline will limit gains marginally above $160 in addition to the hurdles highlighted by the two moving averages.
BCH/USD 1-hour chart