- Ethereum on Thursday is resuming bearish momentum, nursing losses of around 2% into the second half of the session.
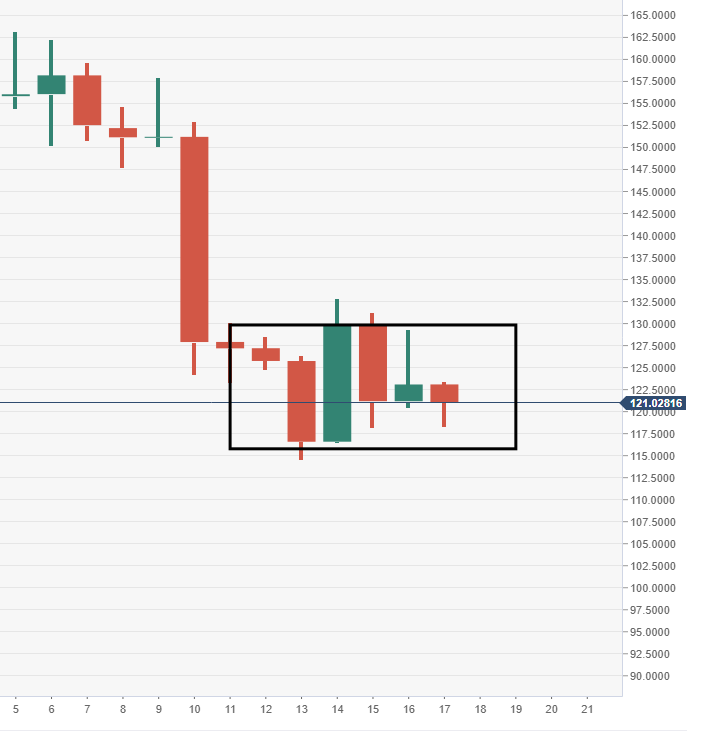
- ETH/USD daily chart view is forming a potential bearish flag structure.
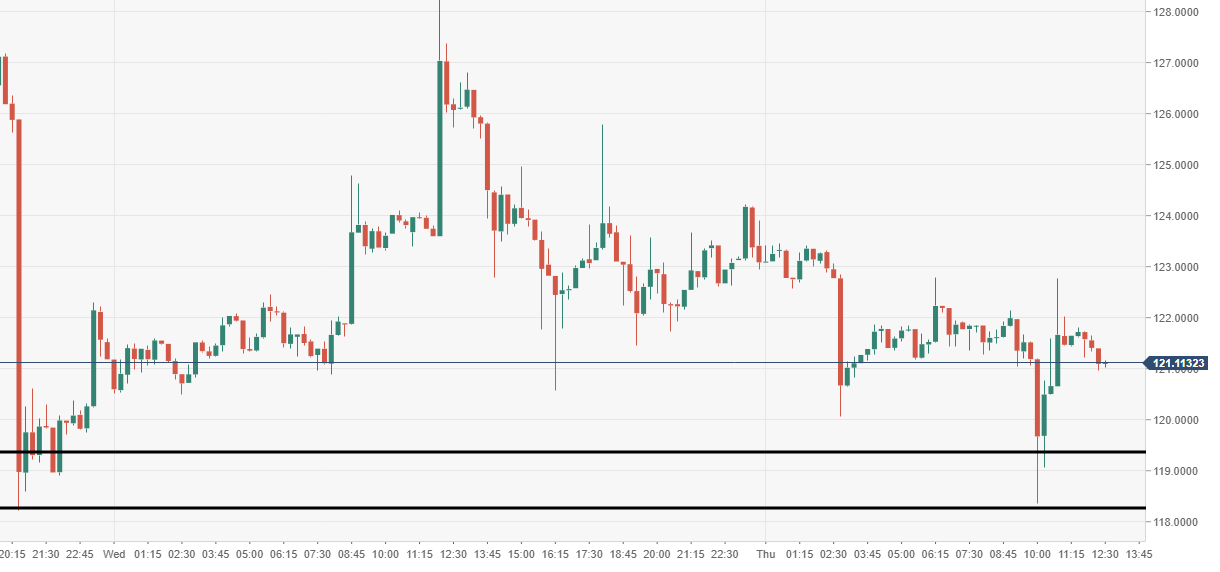
ETH/USD 15-minute chart
- Near-term demand zone providing cushion, buying seen from 118-119 region.
Spot rate: 121.01
Relative change: -1.74%
High: 123.46
Low: 118.36
Trend: Bearish
Support 1: 119.28, daily pivot point support.
Support 2: 115.48, daily pivot point support.
Support 3: 110.48, daily pivot point support.
Resistance 1: 128.09, daily pivot point resistance.
Resistance 2: 133.09, daily pivot point resistance.
Resistance 3: 136.90, daily pivot point resistance.
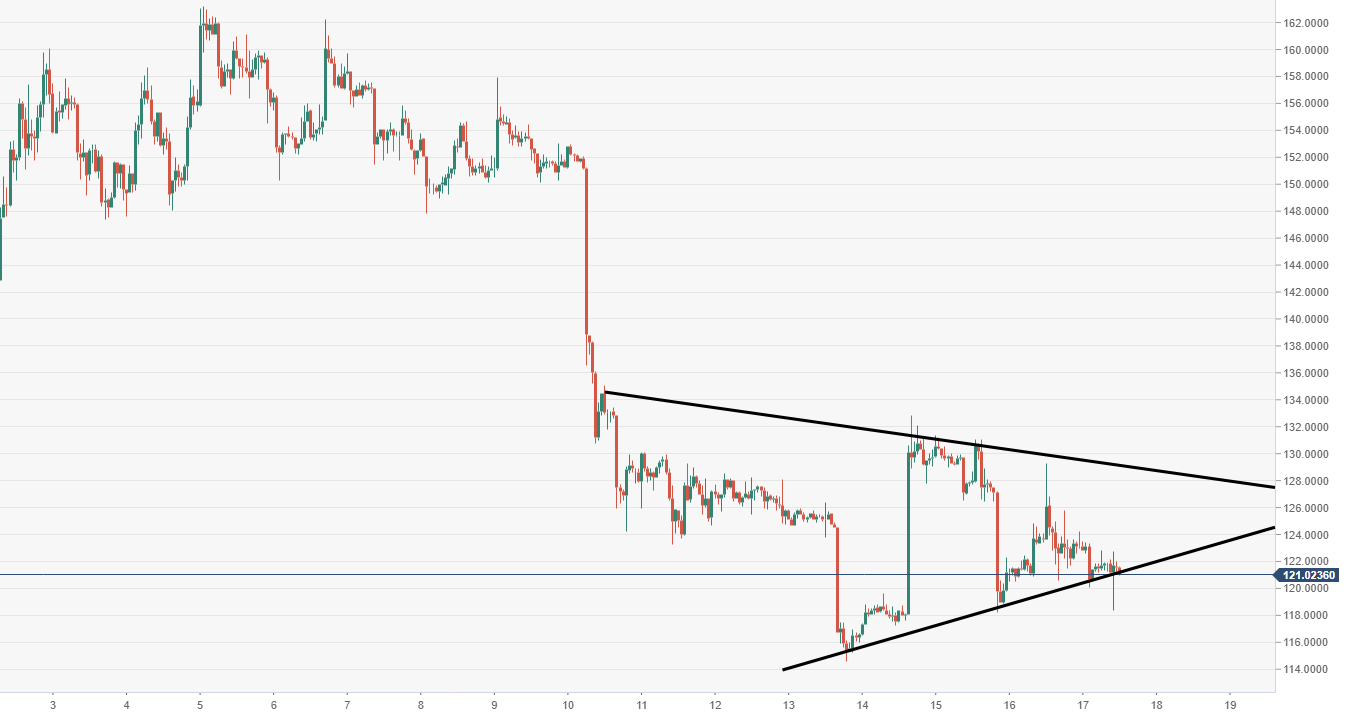
ETH/USD 60-minute chart
- ETH/USD via 60-minute view is moving within a triangular pattern structure, subject to a potential breakout south.
ETH/USD daily chart
- Price action appears to be forming a bearish flag structure via the daily.