- Bitcoin price on Tuesday was seen up 1.40% after starting the session somewhat under pressure from the bears.
- BTC/USD was ever so close to a breach of the daily range-block to the downside, early in the session.
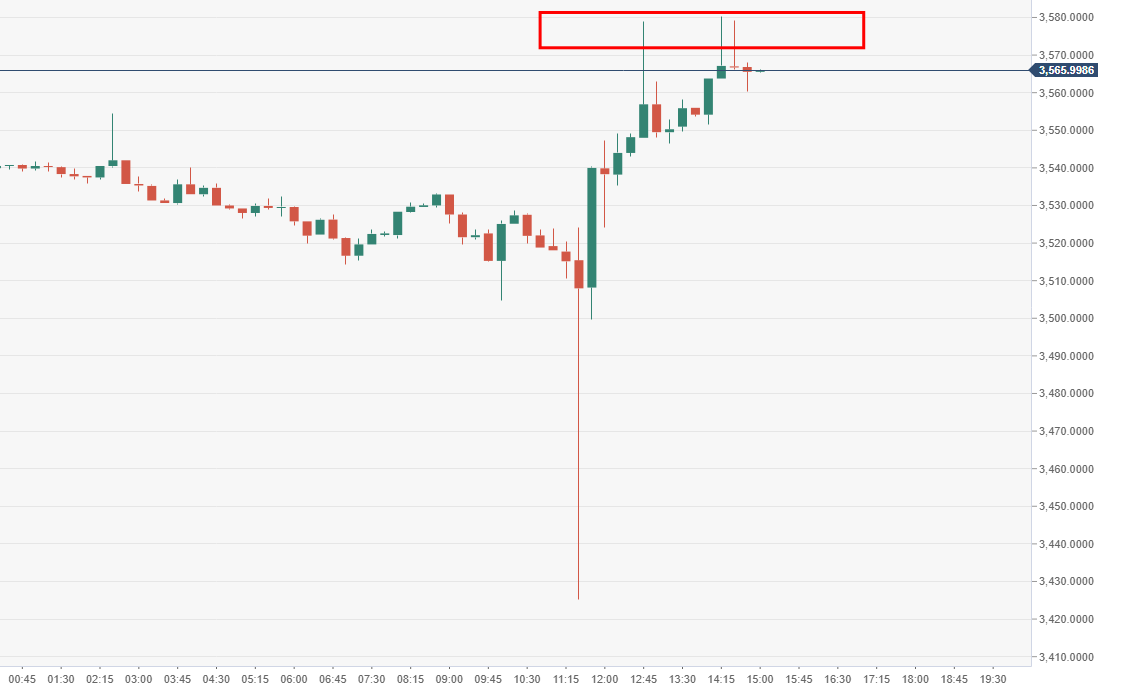
BTC/USD 15-minute chart
- Bulls are have some difficulty breaking down the session high area.
Spot rate: 0.3222
Relative change: +0.88%
High: 0.3238
Low: 0.3083
Trend: Neutral
Support 1: 3493.06, daily pivot point support.
Support 2: 3454.03, daily pivot point support.
Support 3: 3418.24, daily pivot point support.
Resistance 1: 3567.88, daily pivot point resistance.
Resistance 2: 3603.67, daily pivot point resistance.
Resistance 3: 3642.7, daily pivot point resistance.
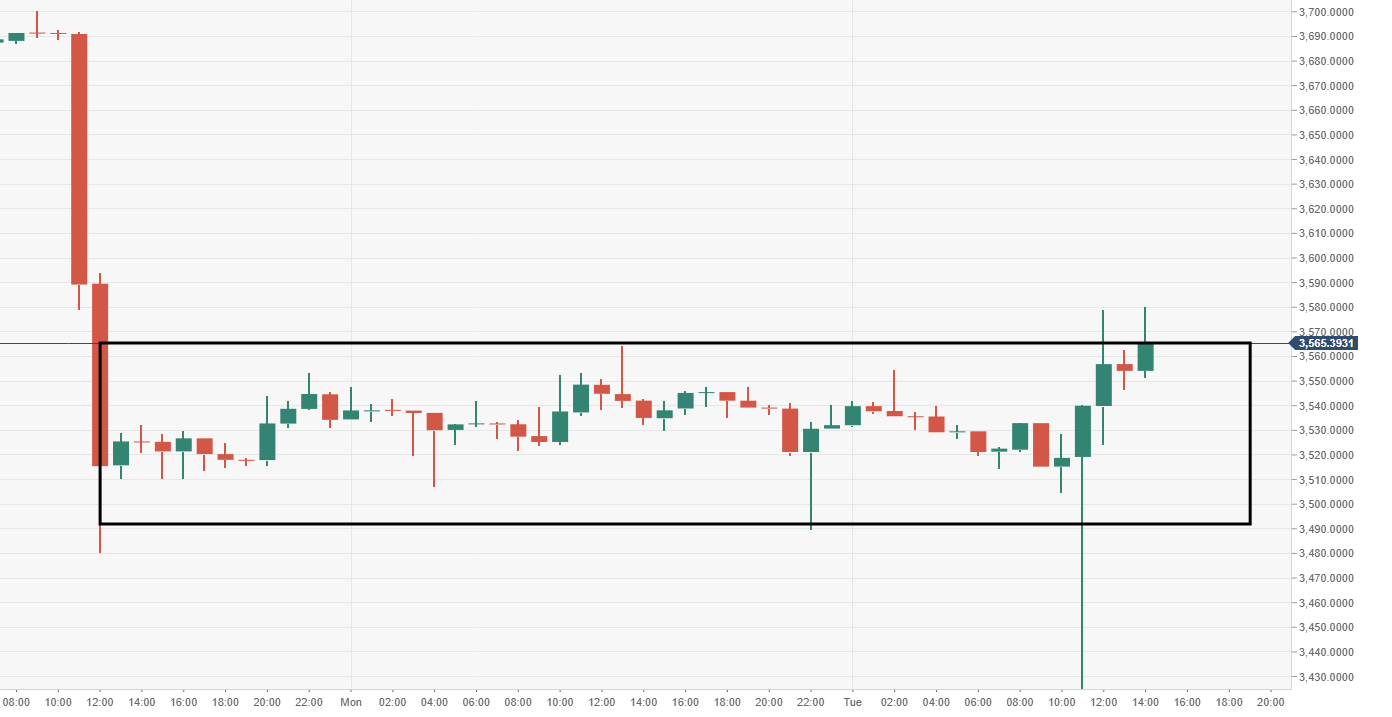
BTC/USD 60-minute chart
- BTC/USD pressing towards a breakout of this extremely narrow two day range.
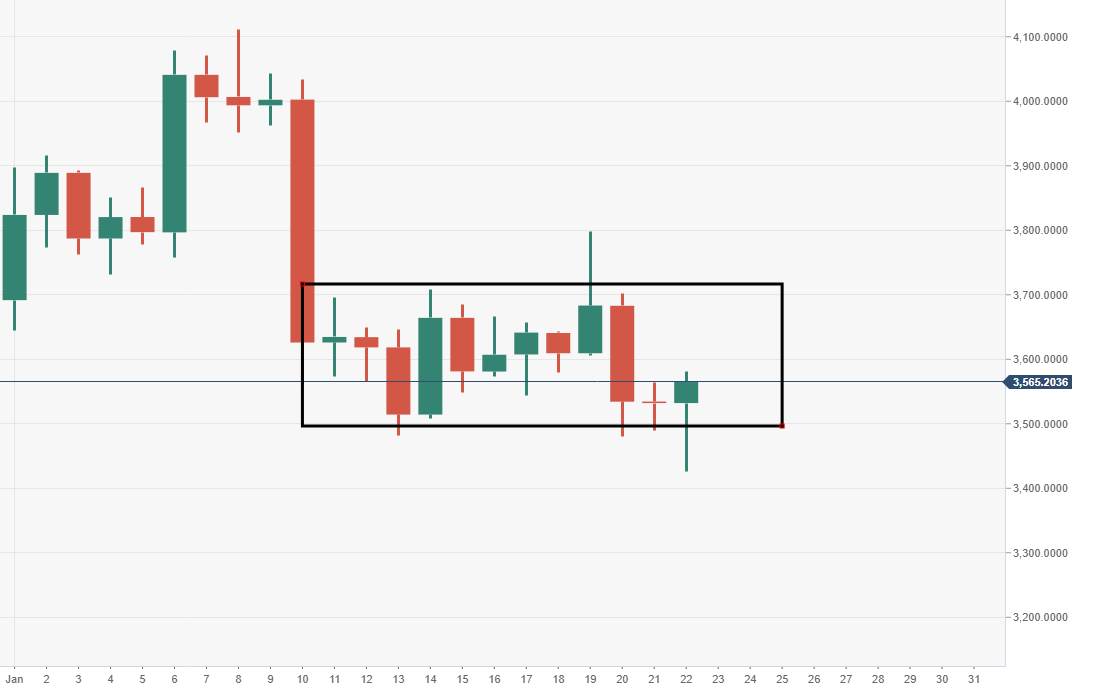
BTC/USD daily chart
- It did at one point today look as though the price was going to crash out of the range-block formation. This would be triggered a potentially new bearish trend.