- XRP/USD deflates 1.1% on the day as bears increase the grip on the market.
- The bulls must defend the key support in order to push the price out of the range resistance.
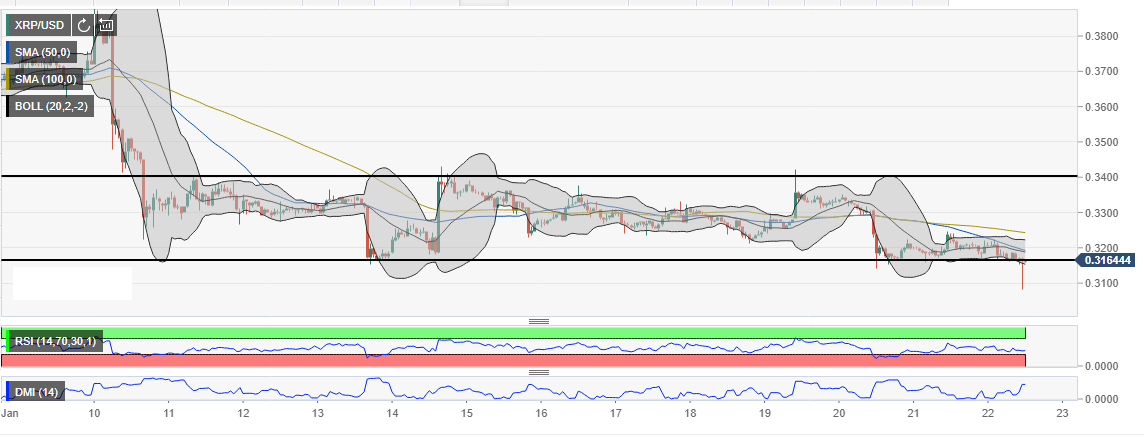
Ripple’s XRP has been trending sideways between a narrow range following the downswing on Sunday. The price remained stable above the key support at $0.31. However, the upside has remained capped below the 50-day Simple Moving Average (SMA) on the 1-hour chart. In addition, the upside is laced with more hurdles starting at the 100-day SMA, the initial supply zone at $0.33 and the second supply zone at $0.34.
The Bollinger bands applied to the chart show that in the past few weeks, stability and constriction leads to a breakdown with the price correcting lower in sharp movements. One such movement took place on Sunday last week where the Bollinger band constriction above $0.33 resulted in a sharp move south as XRP butchered past the support at $0.32 only to take refuge around $0.3145.
At press time, XRP/USD is trading at $0.3165 after bouncing back from testing the key support at $0.31. If a move occurs below this handle, XRP is likely to breakdown further below $0.30 and even refresh this year’s lows around $0.28. However, for an upward retracement, the bulls must defend the support mentioned and push to break above the Moving Average resistance as shown on the chart below. A correction above the range resistance at $0.34 is bound to pave the way for more correction above $0.35 and eventually come into contact with $0.4 (ultimate resistance).
Read more:
Cryptocurrency bloodbath as Bitcoin tumbles below $3,500
XRP/USD 60′ chart