- The bulls lose their mojo on an attempt to push LTC above $35.00.
- Litecoin on the verge of a tailspin due to the reaction to the double-top pattern.
Litecoin is the bull among a sloth of bears as this week’s trading approaches an end. The asset commenced the week battered by the selling pressure that had dominated the market on Sunday. The Bulls lost their mojo on an attempt to push LTC above $35.00. The crypto formed a high around $33.5 before the bears swept in full force sending Litecoin gasping for breath while sinking in the sea of red waters.
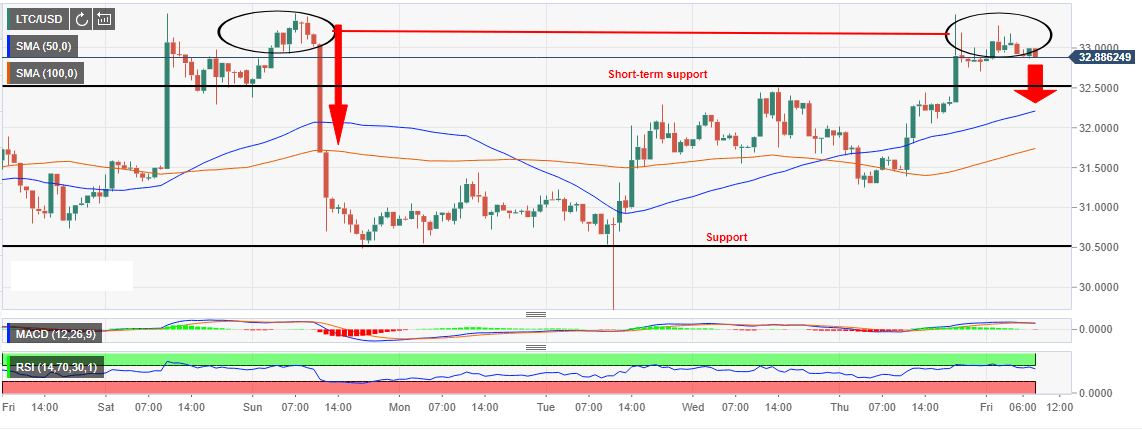
While support was found at $30.50 stopping the declines, Litecoin has been unable to recover to the levels of Sunday last week. However, significant progress has been made with the price zooming above both the 50-day Simple Moving Average (SMA) and the 100-day SMA (1-hour chart). In addition, the bulls pushed the price above $33.00 and in turn forming a double-top pattern on the same chart.
The $1.9 billion digital asset currently ranked in the seventh position on CoinMarketCap, is trading at $32.97. It has corrected higher 4.19% in the last 24-hours and has a 24-hour exchange trading volume of $611 million. The reaction to the above-mentioned double-top pattern is likely to send Litecoin on tailspin trimming gains. If the short-term support at $32.5 fails to hold ground, both the 50-day SMA and the 100-day SMA will be in a position to halt the declines. Another support has been established at the former lows at 30.5.
LTC/USD 1-hour chart