- The DASH/USD market remains bearish as the price threatens to go below the $67.50 support line.
- Technical indicators show that the bulls are trying to stabilize the price with further volatility expected in the short-term.
DASH/USD daily chart
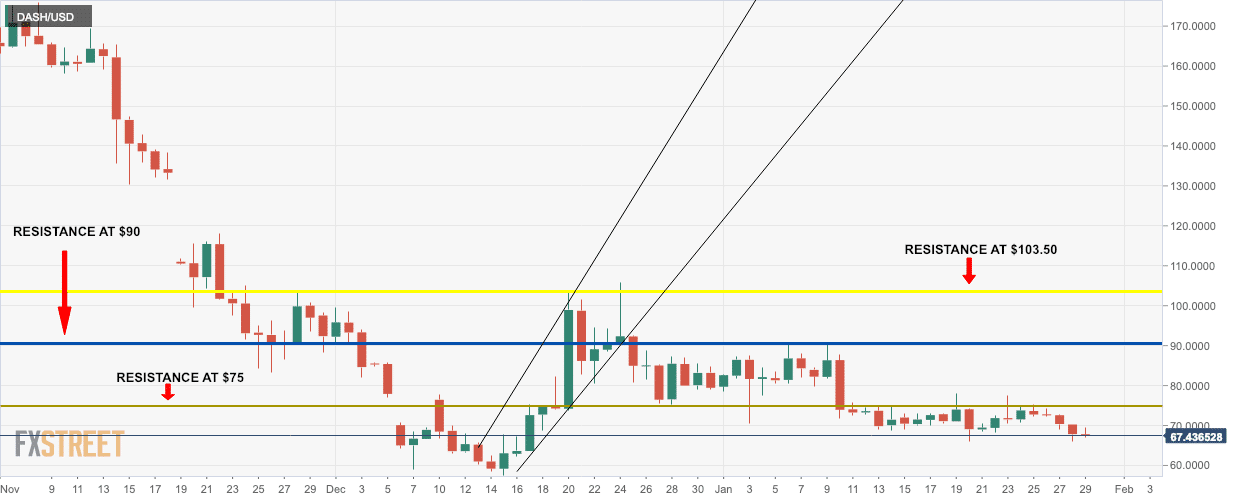
- The daily chart shows that DASH/USD’s price is staying on top of the $67.5 support line.
- The bears have come out on top in the last three days but with the price not undergoing any drastic change, it shows that the bulls are trying to stabilize the price.
DASH/USD 15-min chart

- The 20-day Bollinger band and the moving average convergence/divergence (MACD) indicates at higher price volatility.
- DASH/USD has had a bearish breakout from the triangle, but the buyers are keeping the price over the lower band of the 20-day Bollinger for the last two sessions.
DASH/USD 4-hour chart

- The relative strength indicator (RSI) has creeped out of the oversold territory to hint at a reversal in the downtrend.
- The 20-day simple moving average(SMA-20) curve has crossed paths with the SMA-50 curve to also indicate a reversal.
DASH/USD details
- RESISTANCE 3: $74.41
- RESISTANCE 2: $72.37
- RESISTANCE 1: $70.11
- PIVOT POINT: $68.07
- SUPPORT 1: $65.81
- SUPPORT 2: $63.77
- SUPPORT 3: $61.51
