- XRP/USD has lost 10% of its overall value in the last four days, going down from $0.32 to $0.29.
- Bulls need to rally together as all technical indicators show that the XRP/USD will remain in the bearish territory.
XRP/USD has lost 10% of its overall value in the last four days, going down from $0.32 to $0.29, based on market speculation. There are several technical indicators which indicate that the price may go down even further. The bulls will need to rally together and overcome short-term resistance to prevent the price from sliding down any further.
XRP/USD daily chart
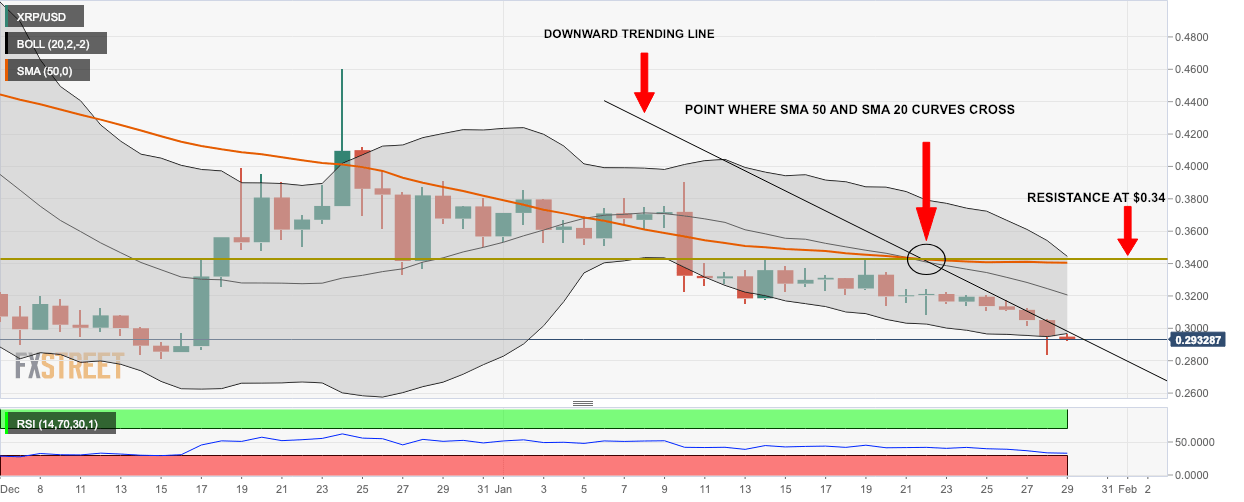
XRP/USD is currently trading at $0.29 and there are several indicators which show that it is going to stay in the bearish territory for the foreseeable future:
- The 50-day simple moving average(SMA50) curve has crossed paths with the SMA20 curve
- The relative strength indicator(RSI) curve is slowly entering the oversold territory
- XRP/USD price has gone below the lower band of the 20-day Bollinger band curve.
Currently, the bulls need to think of short-term goals to overturn the trend. The downward trending line (black) indicates the first point of resistance that they need to overcome.
