- BCH/USD bulls rally back to push the market past the $112 resistance level.
- BCH/USD forms a bearish flag in the 4-hour chart.
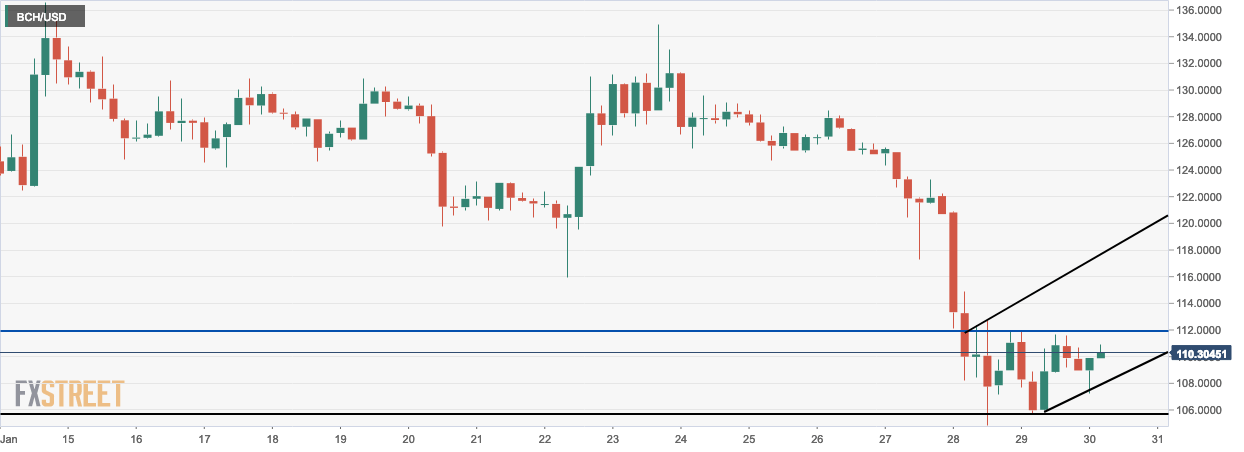
BCH/USD daily chart
-636844211408467204.png)
- BCH/USD bulls look to break past resistance at $112.
- BCH/USD looks to creep back inside the 20-day Bollinger band.
BCH/USD 4-hour chart
- BCH/USD forms a bearish flag as bulls look to break past $112 resistance.
BCH/USD hourly chart
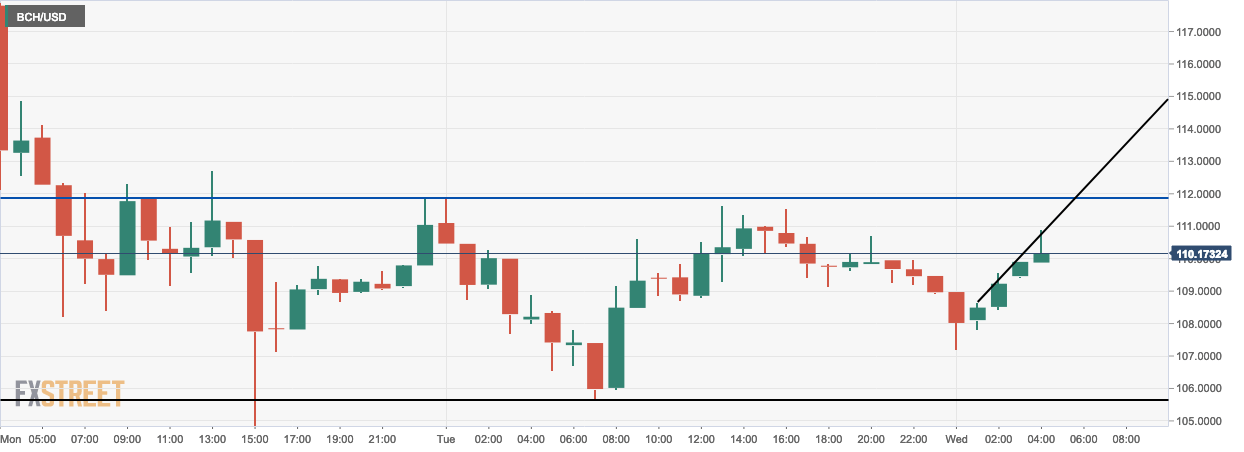
- BCH-USD bulls form an upward trending line as the market tries to break past $112.
BCH/USD key levels
- Resistance 3: $118.1979
- Resistance 2: $115.0290
- Resistance 1: $111.9966
- Pivot Point: $108.8277
- Support 1: $105.7953
- Support 2: $102.6264
- Support 3: $99.5940
