- Ripple’s XRP nursing losses on Thursday of a chunky 4% in the second half of the session.
- XRP/USD is confined within a descending wedge formation, seen via the daily.
XRP/USD 15-minute chart
- Price action is moving within a near-term bearish pennant formation.
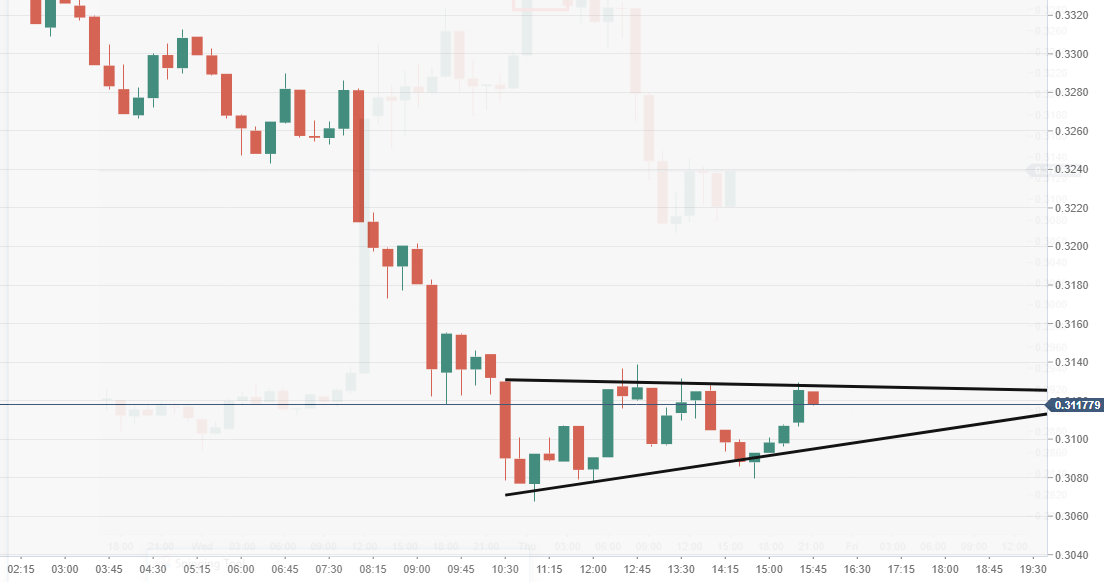
Spot rate: 0.3218
Relative change: -4.05%
High: 0.3382
Low: 0.3067
Trend: Bearish
Support 1: 0.2972, daily pivot point support.
Support 2: 0.2708, daily pivot point support.
Support 3: 0.2553, daily pivot point support.
Resistance 1: 0.3391, daily pivot point resistance.
Resistance 2: 0.3546, daily pivot point resistance.
Resistance 3: 0.3810, daily pivot point resistance.
XRP/USD 60-minute chart
- Evening star formation seen on the 60-minute chart, which followed downside, playing by the textbook.

XRP/USD daily chart
- XRP/USD price action via the daily broke out in previous session and now retesting the a breached wedge.

