- IOT/USD market is trading for $0.275 as the bulls thwarted the bears this Friday.
- While overall sentiment remains bullish, the bears have taken over the market in the short term.
IOT/USD is dragging along at $0.275 as bears took over the market this Friday. Short-term market indicators show bearish domination while the overall sentiment remains bullish.
IOT/USD daily chart
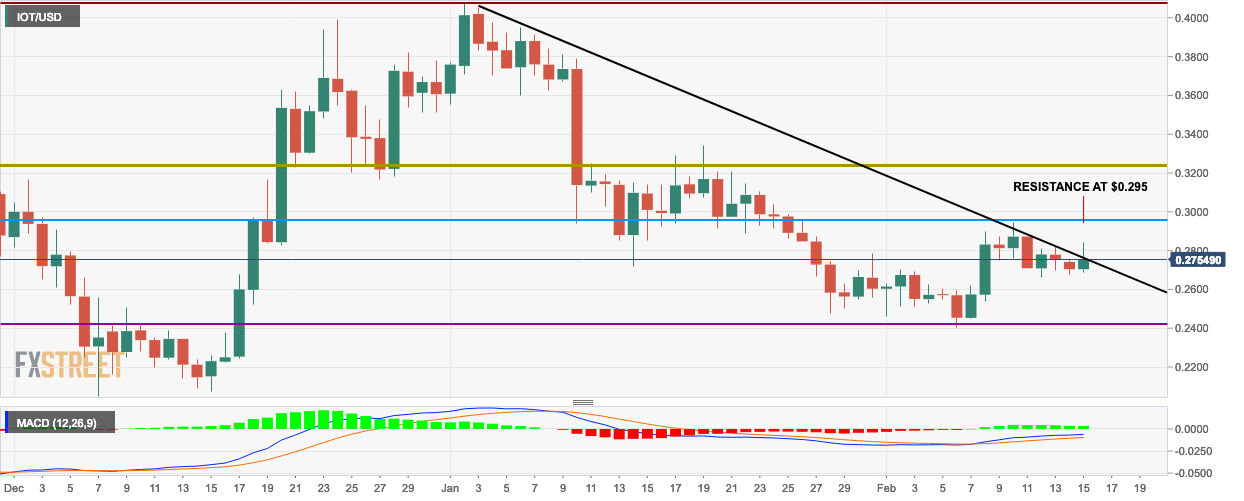
- The last session is bullish and is looking to break past the resistance offered by the downward trending line. Bulls will look to breach resistance at $0.295/
- The moving average convergence/divergence (MACD) histogram shows a bullish movement, even though it lacks momentum.
IOT/USD 4-hour chart

- The IOT/USD 4-hour chart forms a triangle which is prime for a breakout.
- The last session was bearish, but it is still floating on the upper half of the 20-day Bollinger band.
IOT/USD hourly chart

- The 50-day simple moving average (SMA 50) is trending above the SMA 20 curve which is signaling a sell sign.
Key Levels
- Resistance 3: $0.28241
- Resistance 2: $0.27891
- Resistance 1: $0.27466
- Pivot Point: $0.27116
- Support 1: $0.26691
- Support 2: $0.26341
- Support 3: $0.25916
