XRP/USD daily chart
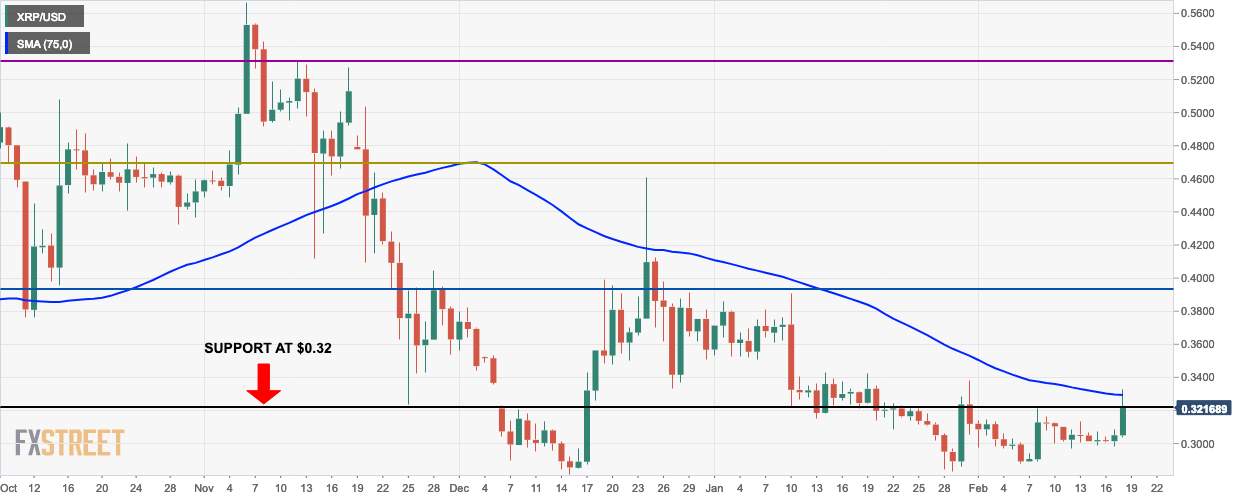
- Daily XRP/USD chart breached resistance at $0.32 as the Bulls took over the market.
- The chart is looking to break past the 75-day simple moving average (SMA 75) curve.
XRP/USD 4-hour chart

- The 4-hour XRP/USD market is trending above the 20-day Bollinger band curve.
- Even though the last session was bearish, it is still above the Bollinger band which indicates a bullish market.
XRP/USD hourly chart
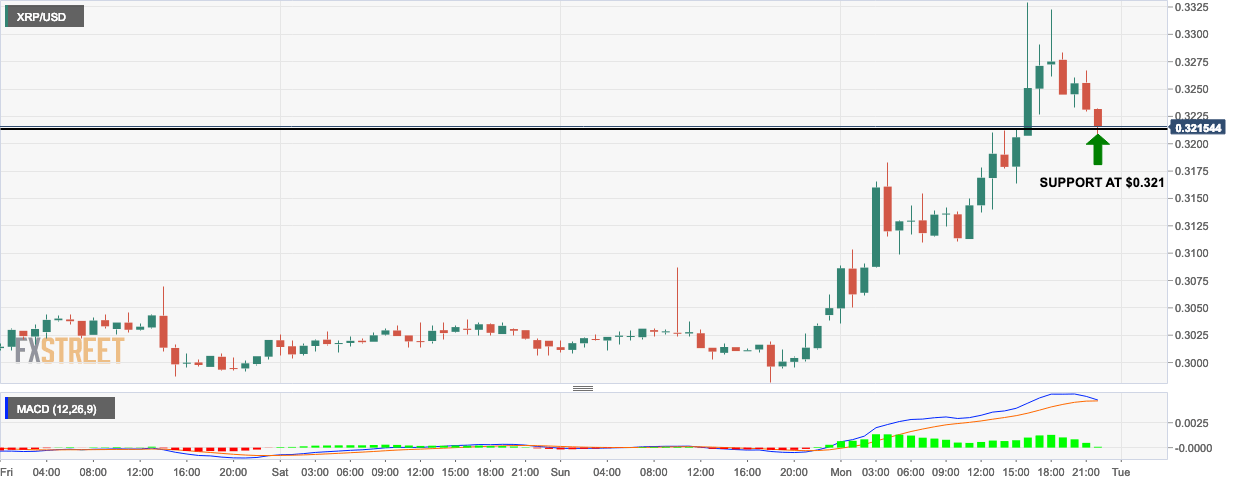
- The hourly XRP/USD chart shows that the bears are mounting a fightback.
- The sellers are trying to get the price below the $0.321 support line.
- The moving average convergence/divergence( MACD) histogram shows that the market is getting less bullish over time.
Key Levels
- Resistance 3: $0.3201
- Resistance 2: $0.3144
- Resistance 1: $0.3097
- Pivot Point: $0.3040
- Support 1: $0.2992
- Support 2: $0.2935
- Support 3: $0.2888
