- Bitcoin price in the second half of the session on Tuesday was seen holding modest gains of 1%.
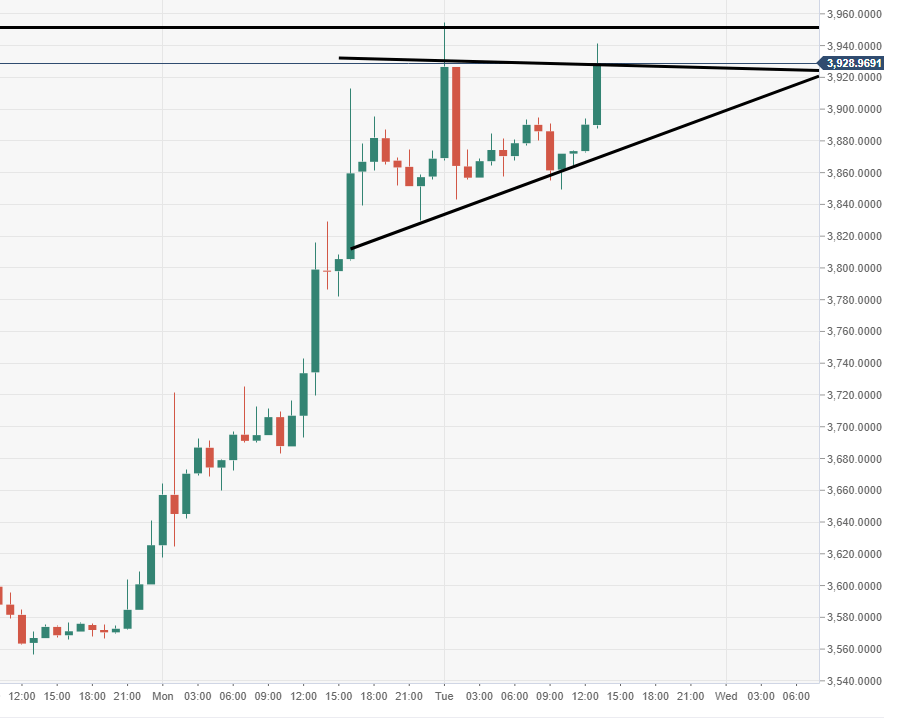
- BTC/USD bullish pennant pattern formation can be eyed via the 60-minute chart view, subject to a breakout.
BTC/USD 15-minute chart
- Price is gunning towards a retest of the session high area, a break would likely open the door to another buying pressure wave.
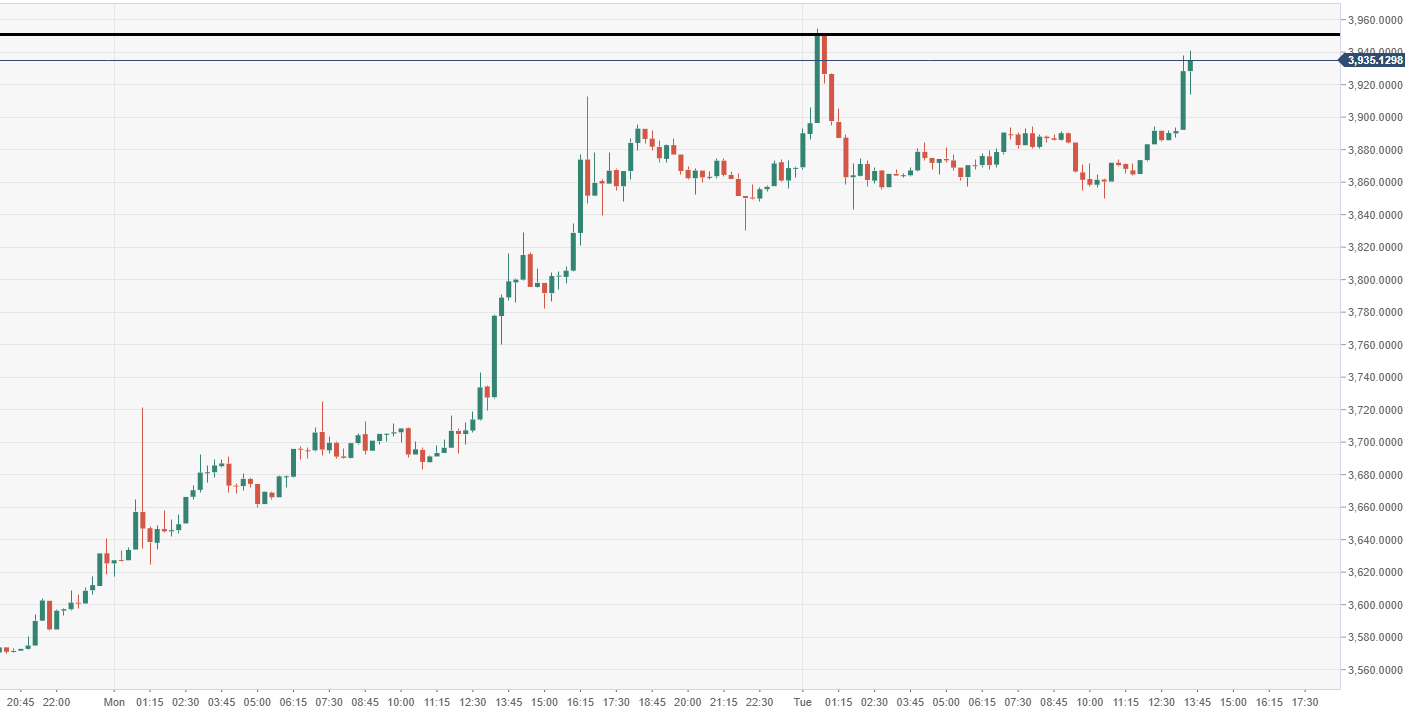
Spot rate: 3924.27
Relative change: +1.02%
High: 3954.85
Low: 3867.93
Trend: Bullish
Trends:
Daily SMA20: 3529.23
Daily SMA50: 3614.23
Daily SMA100: 3983.06
Daily SMA200: 5279.73
Levels:
Previous Daily High: 3912.74
Previous Daily Low: 3617.55
Previous Weekly High: 3655.36
Previous Weekly Low: 3536.68
Previous Monthly High: 4110.71
Previous Monthly Low: 3341.58
Daily Fibonacci 38.2%: 3799.98
Daily Fibonacci 61.8%: 3730.31
Daily Pivot Point S1: 3686.64
Daily Pivot Point S2: 3504.51
Daily Pivot Point S3: 3391.46
Daily Pivot Point R1: 3981.83
Daily Pivot Point R2: 4094.88
Daily Pivot Point R3: 4277.02
BTC/USD 60-minute chart
- Bullish pennant pattern eyed, subject to an extended move to the north.
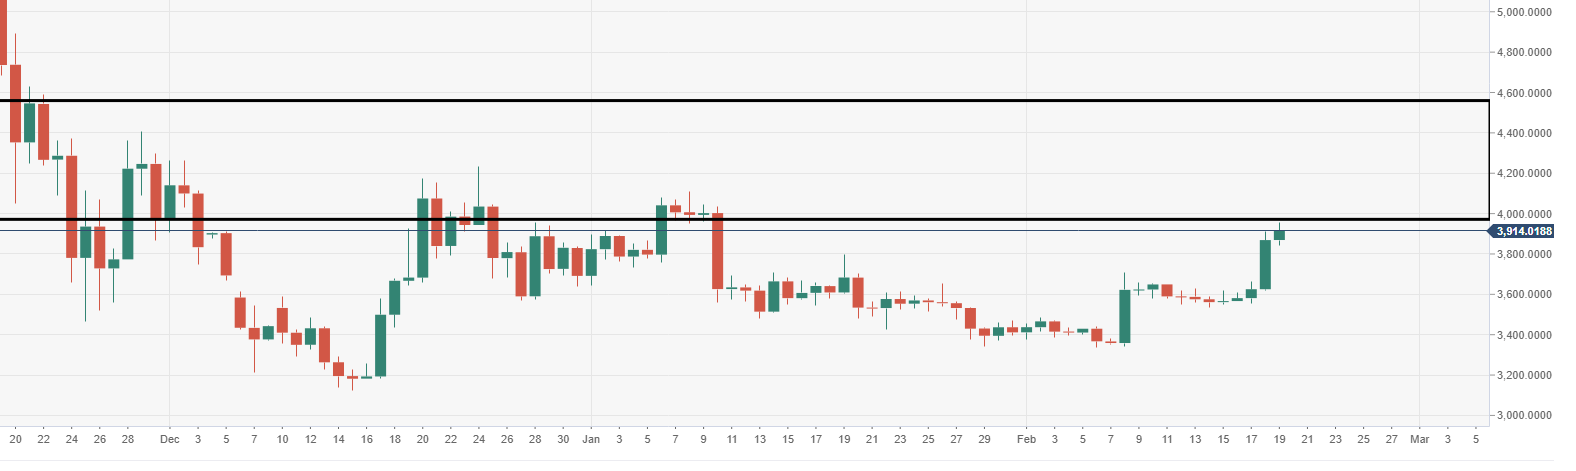
BTC/USD daily chart
- Bulls are gradually guiding the price into a chunky area of supply, tracking from $4000-4500.