EOS/USD daily chart

- The EOS/USD daily market had a bullish breakout from the flag formation.
- The market is looking to breach the 150-day simple moving average (SMA 150) curve.
EOS/USD 4-hour chart
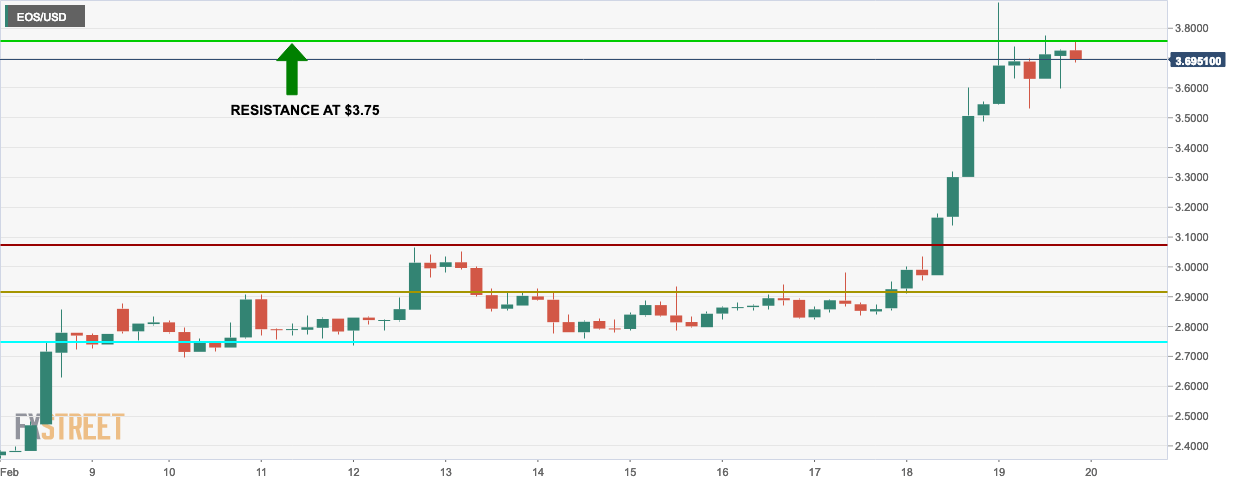
- The EOS/USD 4-hour chart shows that the market is trying to breach the resistance at $3.75.
EOS/USD hourly chart

- EOS/USD hourly chart shows that the bears are trying to stabilize the momentum.
- The 20-day Bollinger band shows that the market is becoming less volatile.
- The moving average convergence/divergence (MACD) shows that the momentum has shifted towards the bears in the short term.
Key Levels
- Resistance 3: $4.48140
- Resistance 2: $4.04070
- Resistance 1: $3.79290
- Pivot Point: $3.35220
- Support 1: $3.10440
- Support 2: $2.66370
- Support 3: $2.41590
