- Bitcoin price is nursing minor losses on Tuesday of just some 0.5%, as it stabilizes after the heavy selling on the weekend.
- BTC/USD price action via the 60-minute view is consolidating, potential formation of a bearish flag pattern observed.
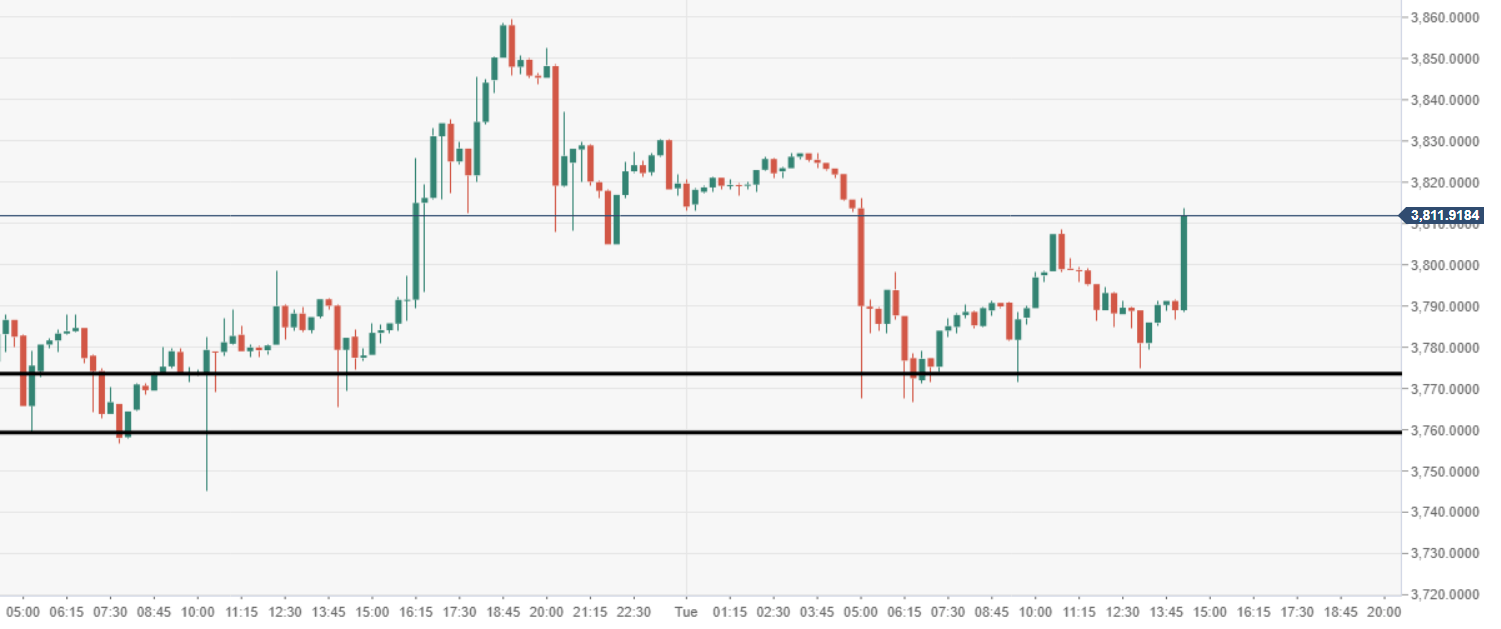
BTC/USD 15-minute chart
- BTC/USD 15-minute view, price has been caught by a near-term area of demand, tracking around $3775 area.
Spot rate: 0.3211
Relative change: -3.01%
High: 3827.21
Low: 3766.83
Trend: Bearish/Neutral
Trends:
Daily SMA20: 3672.06
Daily SMA50: 3626.06
Daily SMA100: 3834.7
Daily SMA200: 5169.62
Levels:
Previous Daily High: 3859.68
Previous Daily Low: 3732.06
Previous Weekly High: 3984.92
Previous Weekly Low: 3556.71
Previous Monthly High: 4110.71
Previous Monthly Low: 3341.58
Daily Fibonacci 38.2%: 3810.93
Daily Fibonacci 61.8%: 3780.81
Daily Pivot Point S1: 3747.95
Daily Pivot Point S2: 3676.2
Daily Pivot Point S3: 3620.33
Daily Pivot Point R1: 3875.57
Daily Pivot Point R2: 3931.44
Daily Pivot Point R3: 4003.19
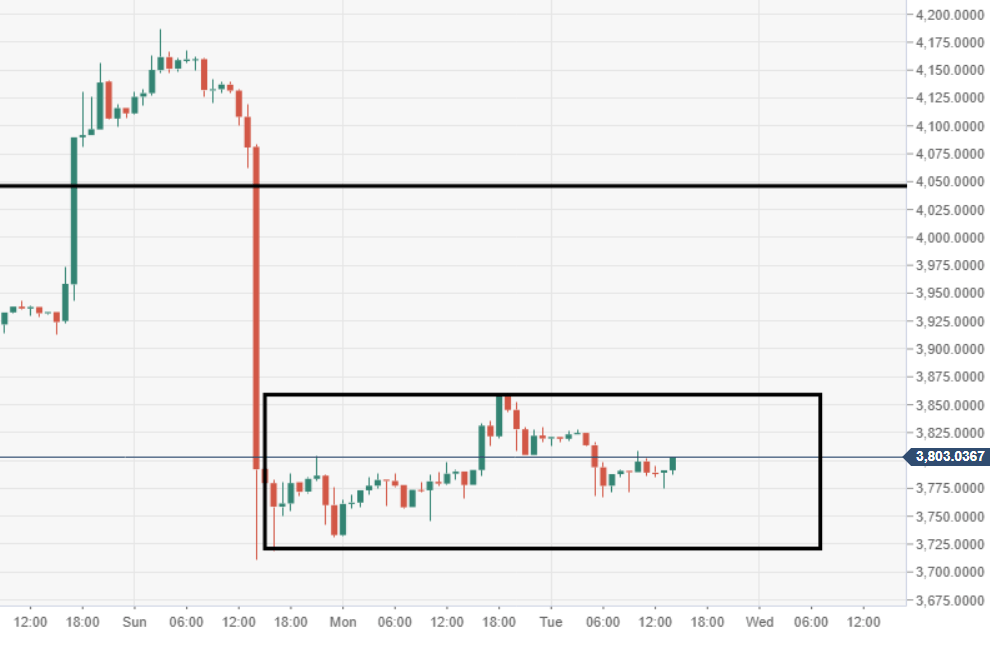
BTC/USD 60-minute chart
- Price action is narrowing and within consolidation mode, since the heavy selling on Sunday. The price has formed somewhat of a bearish flag pattern.
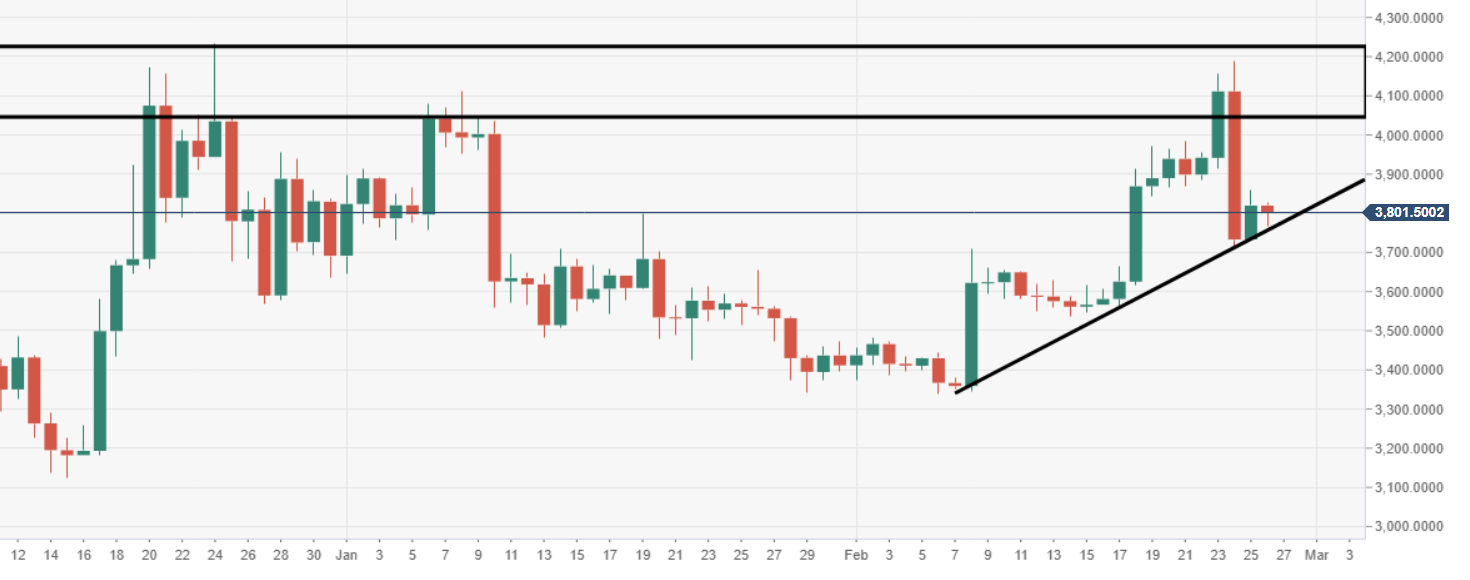
BTC/USD daily chart
- Heavy supply observed from $4000-4200 price range. Daily ascending trend line providing needed comfort for price.