- BTC/USD is currently trading for $3,700 but sees little growth potential with huge stacks of resistance up front.
- BTC/USD has good support at $3,670 but nothing substantial beyond that.
BTC/USD is currently trading for $3,700, as the price went down by 2.27% this Monday from $3,786. The bulls need to rally together to reverse the momentum, however, the daily confluence detector shows huge stacks of resistance up front. The BTC/USD market is supported by only one strong support at $3,670 which needs to be defended by the bulls.
BTC/USD daily confluence detector
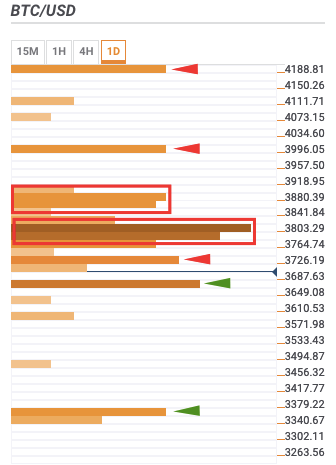
According to the daily confluence detector, the resistance levels are at – $3,740, $3,760-$3,820, $3,845-$3,900, $4,000, and $4,190. The confluences at those levels are:
- $3,740: 5-day simple moving average (SMA 5), weekly pivot point support 3, 15-min Bollinger band middle curve, 15-min previous high, hourly previous high, 15-min Bollinger band upper curve, 4-hour previous high, SMA 100, and hourly Bollinger band middle curve.
- $3,760-$3,820: Daily Bollinger band middle curve, SMA 10, daily pivot point support 1, daily previous low, SMA 50, SMA 200, daily 23.6% Fibonacci retracement level, weekly 23.6% Fibonacci retracement level, 4-hour Bollinger band middle, daily 38.2% Fibonacci retracement level, hourly Bollinger band upper curve, and daily 61.8% Fibonacci retracement level.
- $3,845-$3,900: Daily pivot point resistance 2, daily 161.8% Fibonacci retracement level, weekly 38.2% Fibonacci retracement level, monthly 38.2% Fibonacci retracement level, 4-hour Bollinger band upper curve, and daily pivot point resistance 3
- $4,000: Weekly 61.8% Fibonacci retracement level and monthly 23.6% Fibonacci retracement level.
- $4,190: Previous month high and previous week high.
The support levels are at $3,670 and $3,360. The confluences at those levels are:
- $3,670: SMA 200, previous week low, hourly Bollinger band lower curve, and monthly 61.8% Fibonacci retracement level.
- $3,360: Weekly pivot point support 2 and monthly pivot point support 1.
