- Bitcoin price late on Tuesday was trading up with very minor gains of some 0.30%.
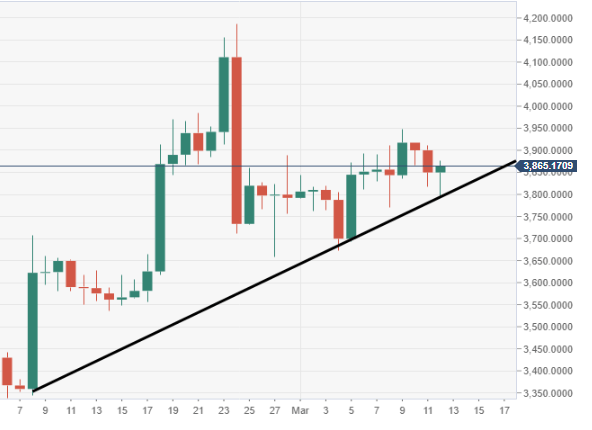
- BTC/USD required support once again from a vital ascending trend line of support.
- Interest for the bulls will be for another attempt at breaking down the supply heading into the $4000 price territory.
Spot rate: 3865.40
Relative change: +0.33%
High: 3875.89
Low: 3796.56
Trends:
Daily SMA20: 3849.53
Daily SMA50: 3656.32
Daily SMA100: 3693.77
Daily SMA200: 4986.36
Levels:
Previous Daily High: 3911.86
Previous Daily Low: 3816.51
Previous Weekly High: 3910.39
Previous Weekly Low: 3672.34
Previous Monthly High: 4187.25
Previous Monthly Low: 3338.98
Daily Fibonacci 38.2%: 3852.93
Daily Fibonacci 61.8%: 3875.43
Daily Pivot Point S1: 3806.95
Daily Pivot Point S2: 3764.06
Daily Pivot Point S3: 3711.61
Daily Pivot Point R1: 3902.3
Daily Pivot Point R2: 3954.75
Daily Pivot Point R3: 3997.64
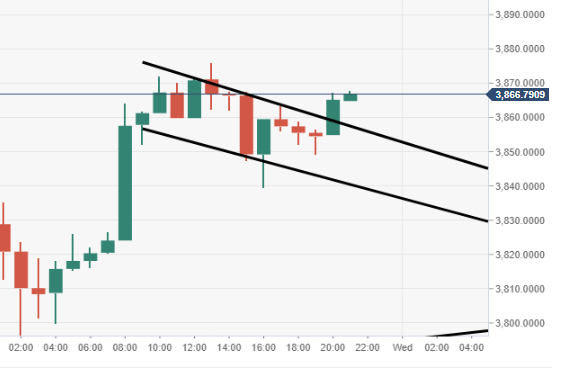
BTC/USD 60-minute chart
- Price looking to extend north out from a bullish flag formation via the 60-minute chart view.
BTC/USD daily chart
- Bulls are attempting to breakdown chunky near-term supply heading into the $60 price territory.