- Ripple extended declines under the demand zone between $0.2950 and $0.30.
- XRP price to stay in the range between the supply zone and the demand zone.
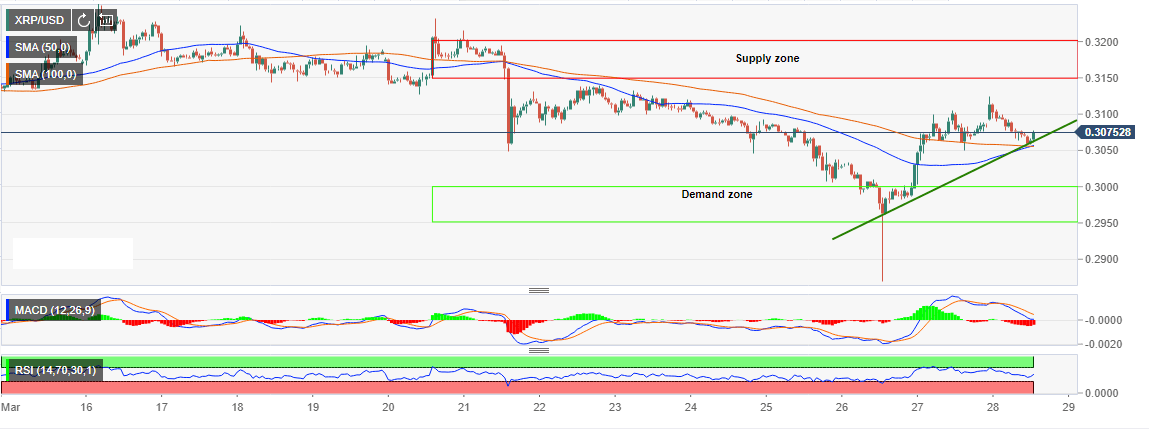
XRP/USD is currently revamping the trend upward following the retracement from the weekly high around $0.3125. Prior to the momentum that formed the weekly high, Ripple made a swing downwards and even extended declines under the demand zone between $0.2950 and $0.30 before finding balance at $0.2869.
XRP/USD 1-hour chart technical outlook
The hourly chart shows that the building bullish momentum is strongly supported by both the 50 SMA and the longer term 100 SMA. Similarly, a double-cross of the shorter term 50 SMA above the 100 SMA means that the buyers are steadily gaining traction. In addition to the simple moving average support, the upside trend is anchored by the ascending trendline.
The Relative Strength Index (RSI) is heading upwards after exploring the levels at 43.24. The indicator was rejected from the overbought region yesterday but its signal remains strongly in favor of the bulls. If the current momentum manages to correct above $0.31, the bulls are likely to gain more confidence and push for a correction past $0.2950 – $0.3200 supply zone. Meanwhile, I expect the price to stay in the range between the supply zone and the demand zone in the coming few days.
XRP/USD 1-hour chart