- The 100 SMA is limiting gains within the triangle pattern.
- Bitcoin Cash to stay in a range between $293.34 and $320 if the triangle breakout backfires.
Bitcoin Cash is among the biggest daily gainers of the day. The bulls are returning to the market following a tug of war on Tuesday. However, the digital assets kept above the key support levels with Bitcoin Cash stayed above the trendline. Short-Term support was established at $293.34 which allowed the buyers to push for gains past $300.
At press time, Bitcoin Cash is trading at $303 with a 2.7% increase in value on the day. The 100 SMA is limiting gains within the triangle pattern. The contracting triangle pattern is approaching a breakout. Stepping above the resistance trendline will place Bitcoin Cash on a trajectory to levels above $230.
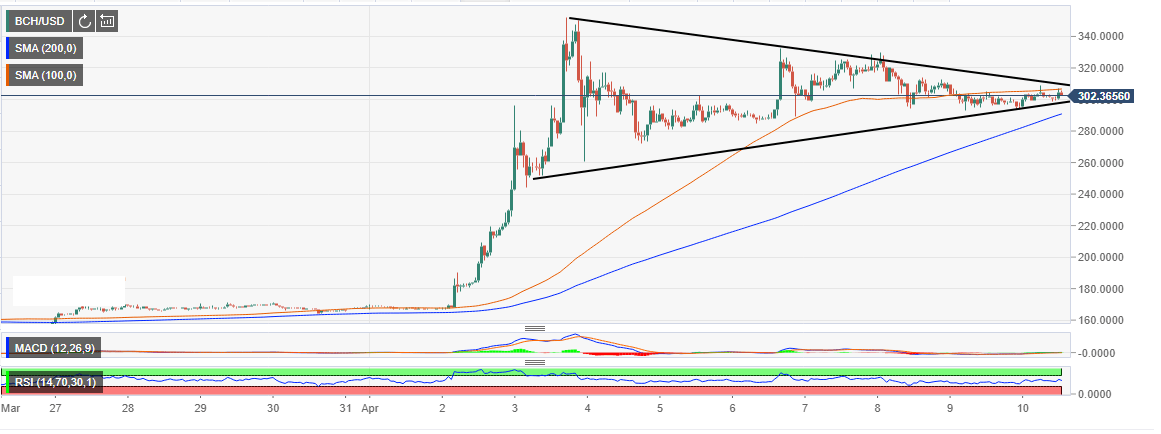
The bulls seem to be increasing their grip on the market with the narrowing gap between the 100 SMA 1-hour and the 200 SMA 1-hour. A double cross of the simple moving averages will mean that Bitcoin Cash has a long term bullish bias. Other indicators like the RSI suggest that Bitcoin Cash will stay in the current sideways range between $293.34 and $320.
BCH/USD 1-hour chart