- The trend is bullish in the short-term but lacks a catalyst to support growth above the 50 SMA 1-hour.
- The ranging RSI shows the path of least resistance is sideways.
Litecoin is steadily returning into the bullish zone in spite of the drop on Thursday. Following the support at $75.00, the bulls have been battling to get a breakthrough above $80.00. An intraday high has been formed at $81.50 but Litecoin has retraced steps to the current $79.92.
The trend is bullish in the short-term but lacks a catalyst to support growth above the 50 SMA 1-hour at $85.00. Technical analysis shows that Litecoin could consolidate the losses in a range between yesterday’s support at $75.00 and today’s high at $81.50. The Relative Strength Index (RSI) at 44.44 is ranging, showing that the path of least resistance is sideways.
LTC/USD 1-hour chart
-636906740959279318.png)
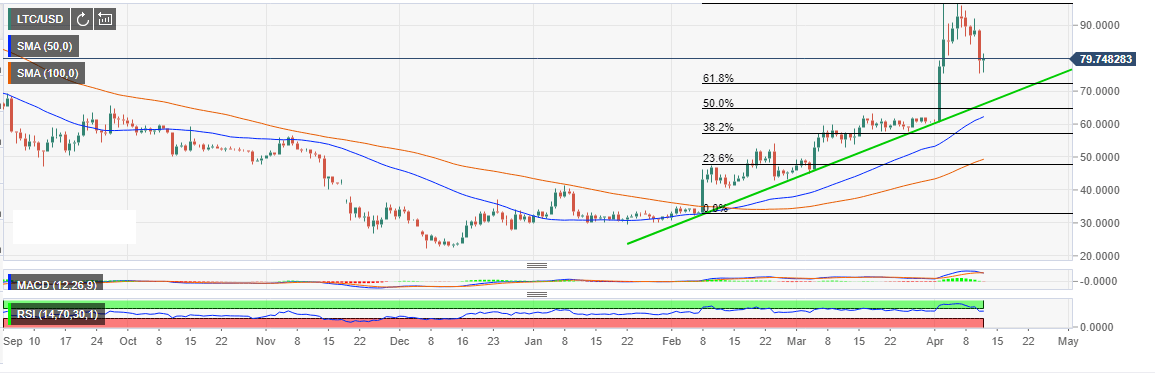
The daily timeframe shows that Litecoin is still in its uptrend. The price is sitting above the rising trendline that has been key support since the beginning of April. If support above $80.00 becomes elusive and the price resumes the declines, the 61.8% Fib level between the last swing high of $96.13 and a swing low of $33.30 will function as support. Extended declines below this will find support at $60.00 and the primary support at $30.00.
LTC/USD daily chart