BTC/USD Daily Chart
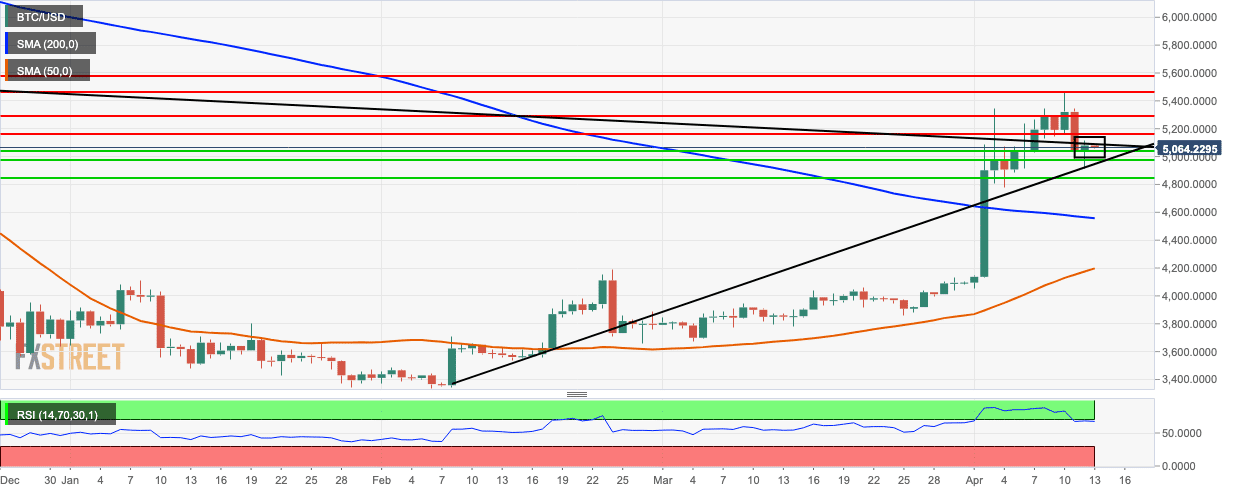
- BTC/USD fell from $5,084 to $5,074 as markets opened this Saturday.
- The daily chart shows that the price is currently consolidating in the flag formation before a potential breakout.
- The market is trending above both the 200-day simple moving average (SMA 200) and SMA 50 curves.
- Bulls need to protect critical $5,045 support line to prevent further downward movement.
- The relative strength index (RSI) indicator is trending right at the edge of the overbought zone.
BTC/USD 4-Hour Chart
-636907155668857690.png)
- The 4-hour BTC/USD chart is trending horizontally in a channel.
- The Elliot wave oscillator shows that the bulls are trying to rally back against the current bearish sentiment of the market.
BTC/USD Hourly Chart
-636907155946374589.png)
- The 20-day Bollinger band is narrowing in the BTC/USD hourly chart, which indicates that market volatility is decreasing.
- The second last session was bearish enough to bring the price down to the SMA 20 curve where it found support and bounced back up.
- The signal line was about to converge with the MACD line, but it has since diverged, and the two lines have been trending parallelly for quite some time.
Key Levels
