EOS/USD Daily Chart
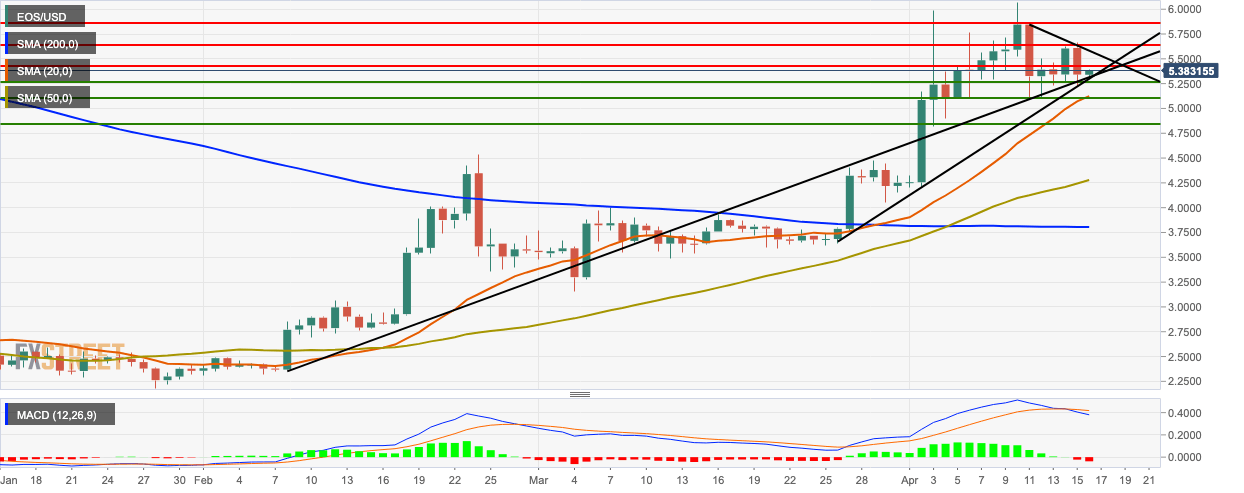
- EOS/USD went up slightly from $5.34 to $5.376 in the early hours of Tuesday.
- EOS/USD had a bearish Monday when the price went down from $5.60 to $5.34, completely negating Sunday’s gains.
- The market is trending above the SMA 200, SMA 50, and SMA 20 curves.
- The signal line diverged from the MACD line showing increasing bearish momentum.
- On the upside, resistance levels lie at $5.42, $5.64, and $5.82.
- On the downside, support levels are at $5.27, $5.10, and $4.83.
EOS/USD 4-Hour Chart
-636909753717643379.png)
- The Ichimoku indicator on the 4-hour EOS/USD chart shows that the market will be enjoying bullish momentum in the near future.
- The market is trending below the SMA 20 and SMA 50 curves.
- The three latest sessions in the Elliot Wave Oscillator are bearish.
EOS/USD Hourly Chart
-636909753960618476.png)
- The hourly EOS/USD is currently trending inside a channel prior to a breakout.
- The SMA 20 curve has already crossed the SMA 200 curve and is looking to intersect the SMA 50 curve as well. This is a bearish sign.
- The relative strength index (RSI) indicator has gone up from the oversold territory.
