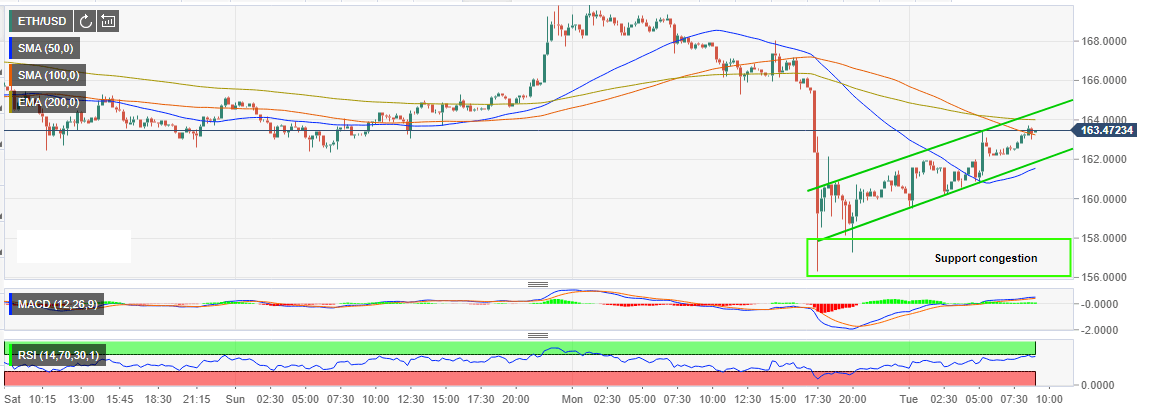
- ETH/USD slide past $160 dipped under $158 before finding balance at $156.32 (within the support congestion zone).
- Ethereum corrects from the support congestion zone within a rising channel.
Ethereum bulls attempt to push the price past $170 failed miserably with the trend reversing below $160. A subtle correction was mad initial from $170 but seemed to have found support above $168. However, a bearish engulfing candle signaled a continued downtrend giving sellers more confidence. The slide past $160 dipped under $158 before finding balance at $156.32 (within the support congestion zone).
The price did not, however, stay down for long as a bounce erupted above $160. The price has since between trading between a rising channel. A step past the 50 simple moving average (SMA) 15-minutes pulled ETH/USD higher above $163. At present Ethereum is dancing with $163.27 with its upside immediately limited by the 100 moving average exponential (EMA). Further correction towards $170 will depend on the ability of the price to correct above $164.00 and $166 – $168 resistance areas.
On the flipside, the price is immediately supported by the 100 SMA 15-minutes currently at $163.34. The second support lies at $162.00 while the 50 SMA will offer support at $161.60. Other support areas to look out for include $160 and the support congestion zone between $156 – $158.
ETH/USD 15′ chart