- Bitcoin Cash price on Wednesday is moving within the red, nursing minor losses of some 2.80%.
- BCH/USD price action via the daily chart view is moving within a bullish pennant pattern formation.
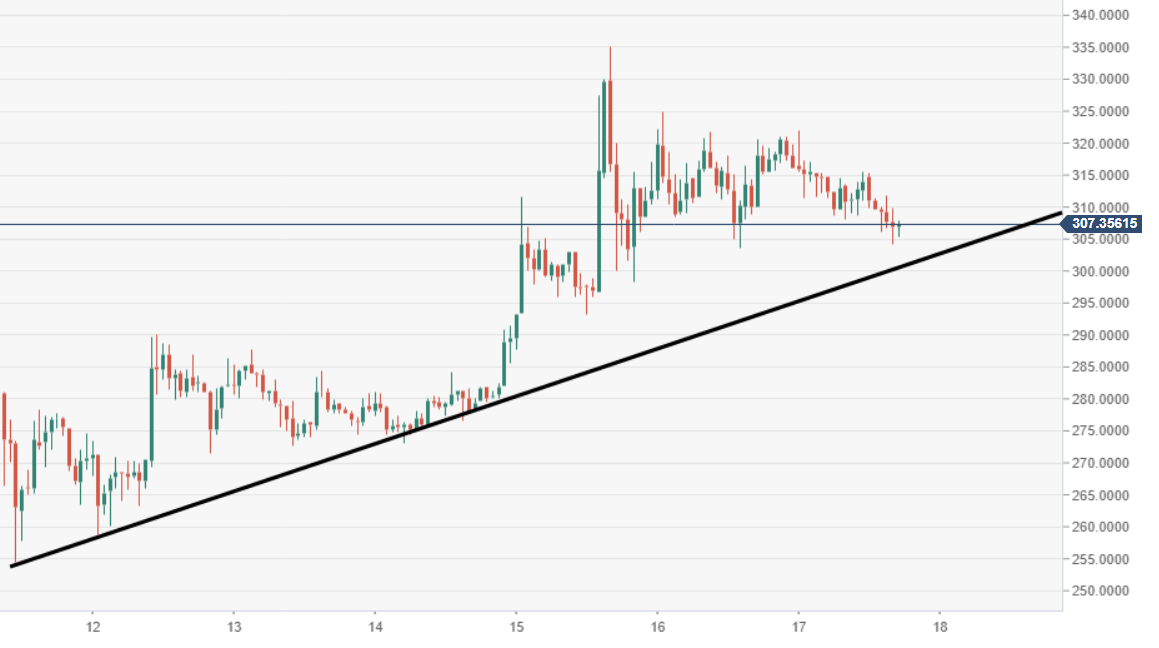
- 60-minute chart view sees price action well supported by an ascending trend line.
Spot rate: 321.964
Relative change: -2.80%
High: 321.94
Low: 304.15
BCH/USD 60-minute chart
- Price action is being supported to the upside by an ascending trend line, preventing a free-fall south.
BCH/USD daily chart
- The daily time frame can see a bullish pennant pattern formation, subject to a breakout.

