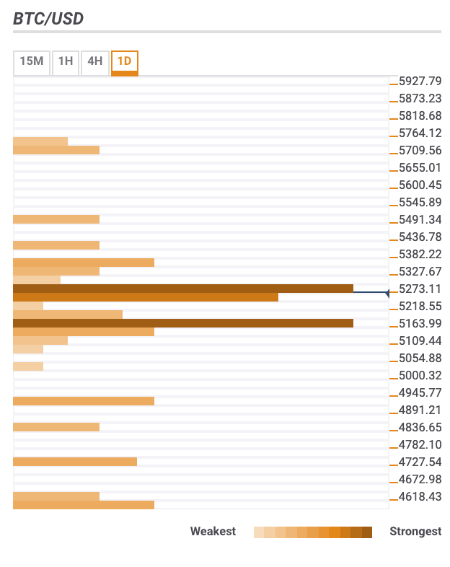
- BTC/USD bulls stop short of $5,300.
- The price is sandwiched between strong support and resistance areas.
Bitcoin (BTC) capped by $5,300. The largest digital asset touched $5,298 high during Asian hours but failed to break above the critical resistance as the upside momentum was not strong enough to take the price above a cluster of short-term sell orders.
Bitcoin confluence levels
BTC/USD is still sandwiched in a tight range and, technically, little has changed since this time on Wednesday. While the price continues moving within an upside channel, we may see a retreat towards its lower boundary before the growth is resumed.
Resistance levels
- $5,270-$5,300 – A cluster of technical levels located right above the current price include a host of SMA levels, 23.6% Fibo retracement daily, 38.2% Fibo retracement weeky, upper boundary of 15-min Bollinger Band.
- $5,350 – 23.6% Fibo retracement weekly and Pivot Point 1-day Resistance 3.
- $5,468 – he previous week high
Support levels
- $5,220-$5,200 – 38.2% Fibo retracement daily, 61.8% Fibo retracement daily, and a middle line of a 1-hour Bollinger Band and a host of SMA levels.
- $5,140 – SMA200 and SMA50 4-hour, SMA100 1-hour, middle line of a 1-hour Bollinger Band
- $4,960 – middle line of 1-day Bollinger Band, previous week low.
BTC/USD 1D

