- Bitcoin bulls managed to push for gains above $5,400 but the upside has been capped at the Bollinger middle curve.
- Bitcoin is stuck between a narrow range between $5,400 and $5,464.99 (Bollinger Band upper).
BTC/USD has been bearish since it hit new 2019 highs amid increasing volatility this week. Bitcoin maintained a steady rise above $5,200 in the last week. A break above both the 50 simple moving average (SMA) and the 100 SMA 1-hour saw the price gain momentum above $5,300. Bitcoin later pushed above $5,400 resistance and extended the gains past $5,500 and $5,600. Moreover, a new 2019 high was formed at $5,633.20 before a reversal began.
Initially, the declines had been supported at $5,500 leading to a correction above $5,600. However, on failing to extend the correction further up, the price plunged like a stone resulting in April’s worst selloffs. The Bollinger Band widened to show the increasing market volatility. The 50 SMA failed to offer support as the losses progressed below $5,400 to form a low at $5,376.33.
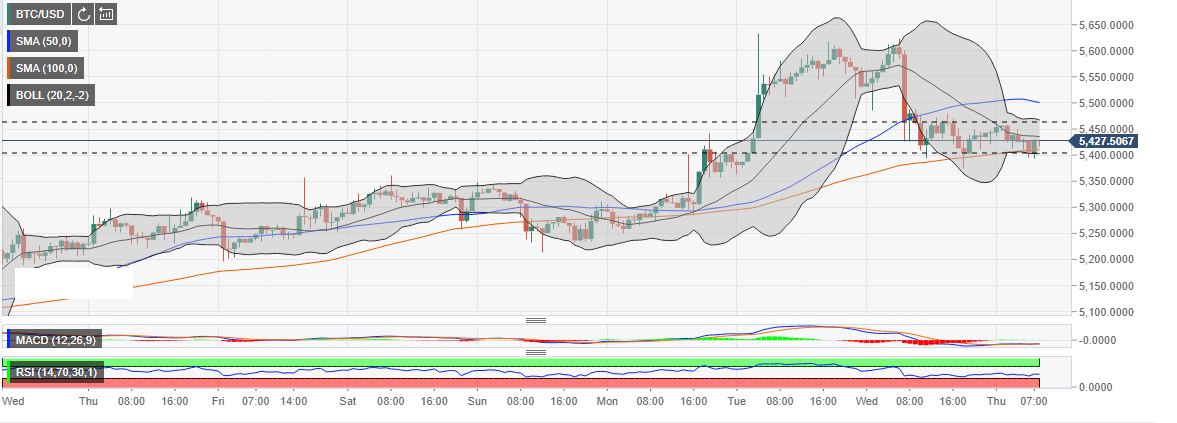
Bitcoin bulls managed to push for gains above $5,400 but the upside has been capped at the Bollinger middle curve. The 100 SMA is offering support at press time slightly above $5,400 while BTC/USD is exchanging hands at $5,427.89. Moreover, Bitcoin is stuck between a narrow range between $5,400 and $5,464.99 (Bollinger Band upper). The trend shown by the indicators like the RSI and the MACD is sideways and likely to stay the way in the coming sessions today.
BTC/USD 1-hour