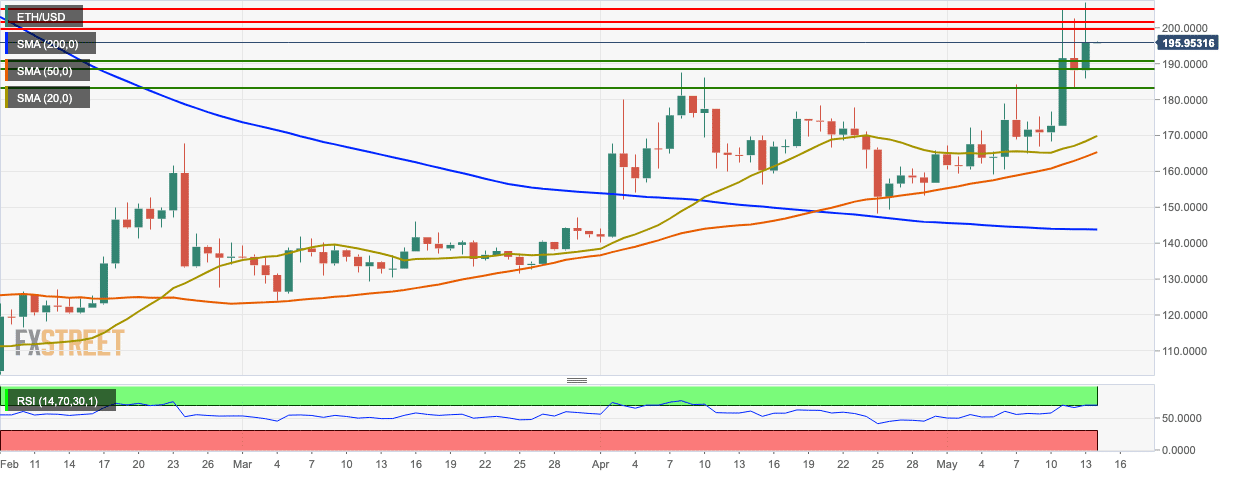
ETH/USD Daily Chart
- ETH/USD is currently trading at $197.80 this Tuesday.
- This Monday, the price went up to $207.20, before the bears re-entered the market and brought it down to $196 at EOD.
- The price is trading above the SMA 200, SMA 50, and SMA 20 curves.
- The Relative Strength Index (RSI) indicator is trending in the overbought zone.
ETH/USD 4-Hour Chart
-636933905889764339.png)
- The 4-hour ETH/USD market found support at $195.25.
- The signal line is converging with the MACD line indicating decreasing bullish momentum.
- The Ichimoku Indicator shows upcoming bearish sentiment.
- On the downside, support levels lie at $194.
ETH/USD Hourly Chart
-636933905637434510.png)
- The 20-day Bollinger band in the hourly ETH/USD chart is narrowing, which shows decreasing market volatility.
- The second last session was extremely bearish and brought the price down to the 20-day simple moving average (SMA 20).
- The hourly ETH/USD found support on the SMA 20 curve and bounced back up.
- The second last session brought the price below the upward trending line.
- The Elliot Oscillator shows five consecutive bearish sessions.
Key Levels
