BTC/USD Daily Chart
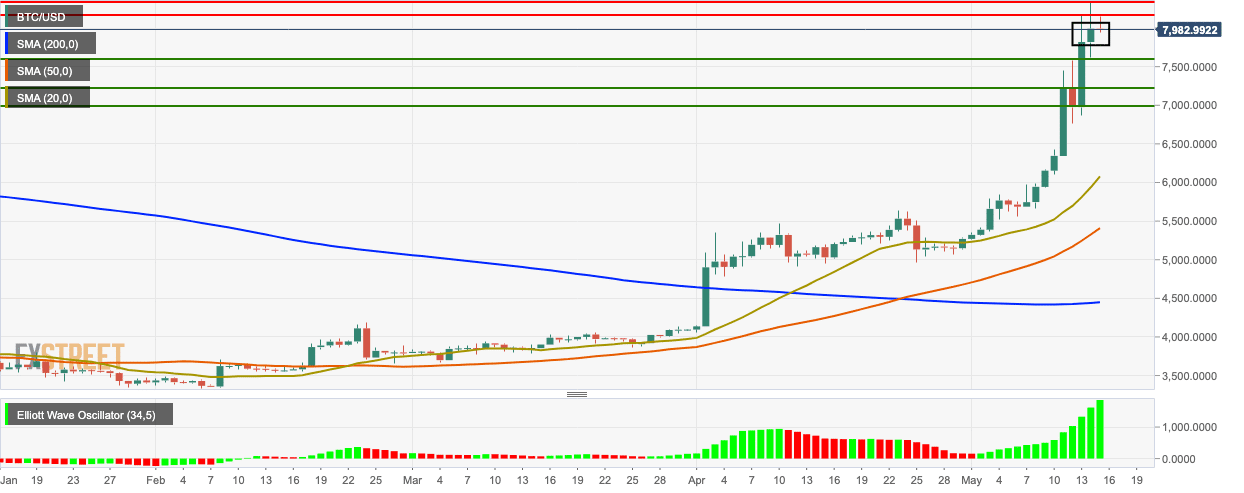
- BTC/USD is currently trading for $8,020.
- The bulls will be aiming for the $8,050 level in the short-term.
- The price is currently consolidating in a flag formation priming for a breakout.
- BTC/USD is comfortably trading above the SMA 200, SMA 50, and SMA 20 curves.
- The Elliot wave oscillator shows 14 consecutive bullish sessions.
BTC/USD 4-Hour Chart
-636934838384921263.png)
- The 4-hour BTC/USD market has had a bullish outbreak from the triangle formation.
- The chart overtook the upper curve of the 20-day Bollinger band five sessions back but then crept back inside towards the SMA 20 curve.
- The price found support on the $7,770 line and bounced back up.
- The relative strength index (RSI) indicator is creeping next to the overbought territory.
BTC/USD Hourly Chart
-636934838795088002.png)
- The hourly price is currently trending inside a cup and saucer pattern.
- The price found support on the upward trending line and bounced back up.
- The signal line is converging with the MACD line indicating decreasing bearish momentum.
Key Levels
