XRP/USD Daily Chart
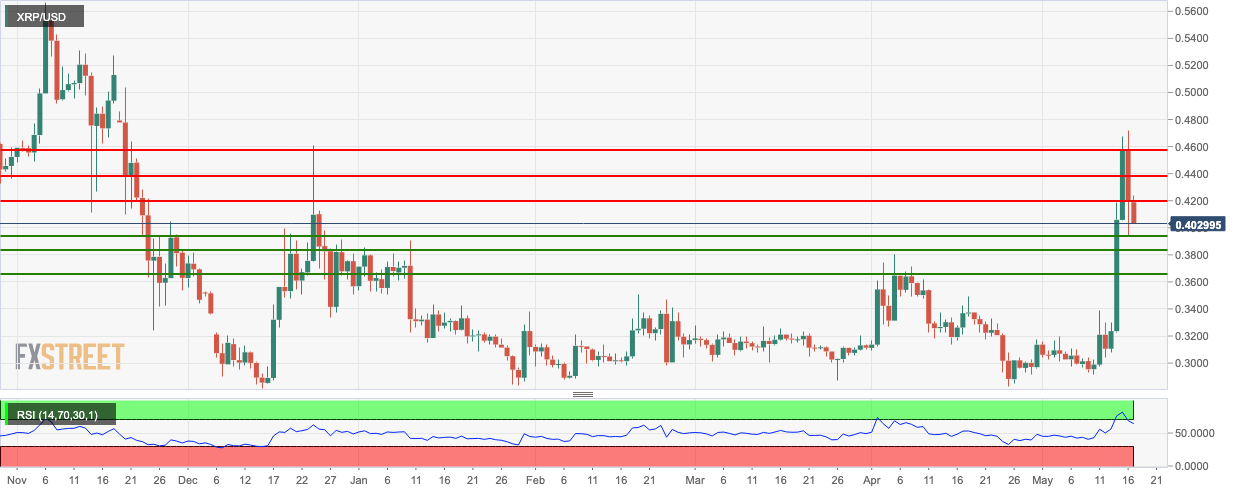
- XRP/USD went down from $0.419 to $0.405 in the early hours of Friday.
- The nearest support level is at $0.395.
- The SMA 20 curve is about to crossover with the SMA 50 curve, which is a bullish sign.
- The relative strength index (RSI) indicator has crept out of the overbought zone.
XRP/USD 4-Hour Chart
-636936565747193437.png)
- The 4-hour price was trending upwards in a channel formation before the price took a dip.
- The market is prime for a bearish breakout from the triangle formation.
- The Elliot wave oscillator shows six consecutive bearish sessions.
- The Ichimoku indicator shows that near-term sentiment will be bearish as well.
XRP/USD Hourly Chart
-636936564635457828.png)
- The 20-day Bollinger band shows decreasing market volatility.
- The price is currently trending in the lower half of the Bollinger band.
- The moving average convergence/divergence shows sustained bearish momentum.
- The SMA 50 curve has crossed over with the SMA 20 curve, which is a bearish sign.
Key Levels
