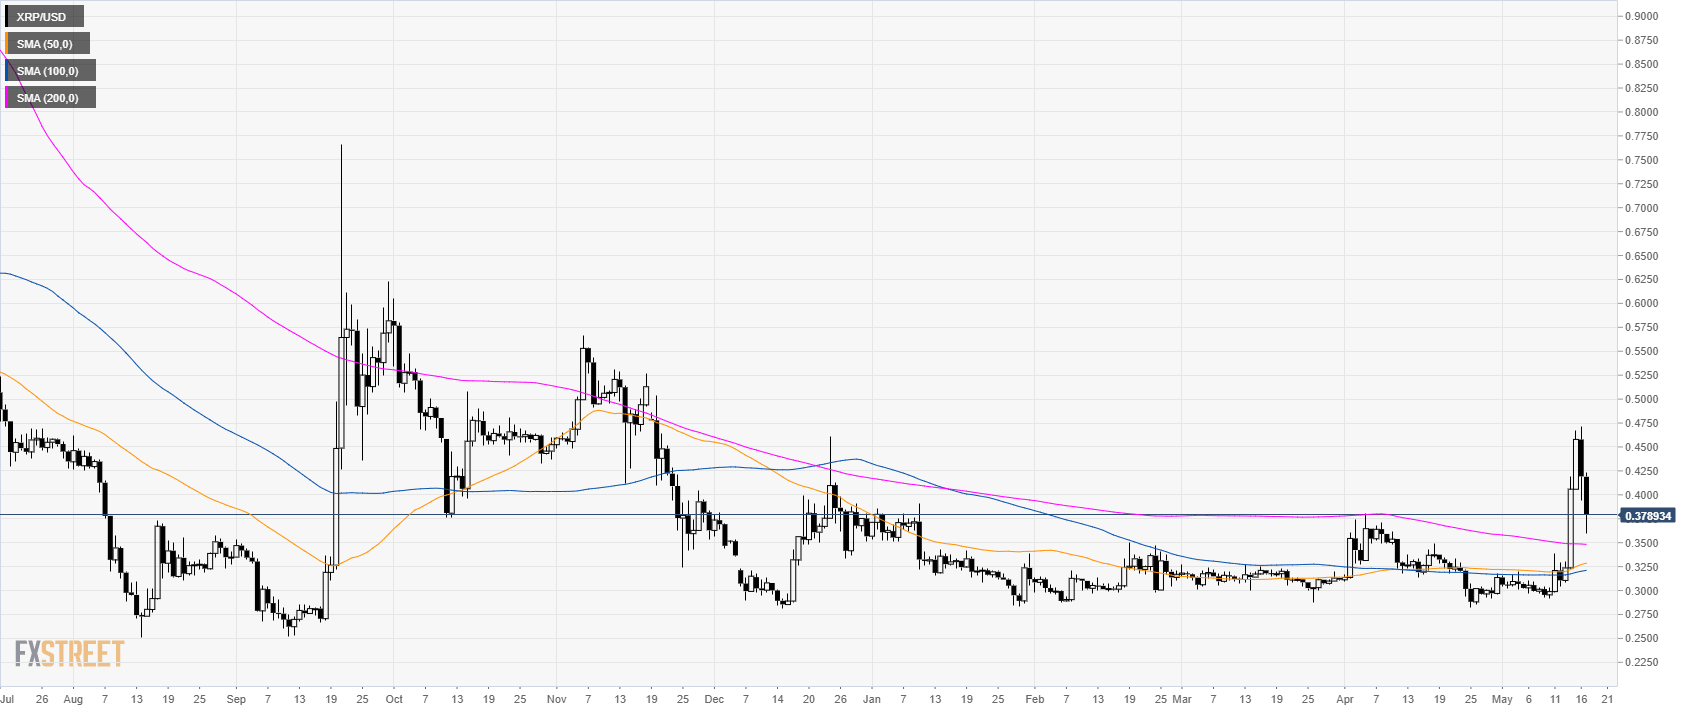
XRP/USD daily chart
XRP/USD is correcting the bullish breakout the market had earlier in the week.
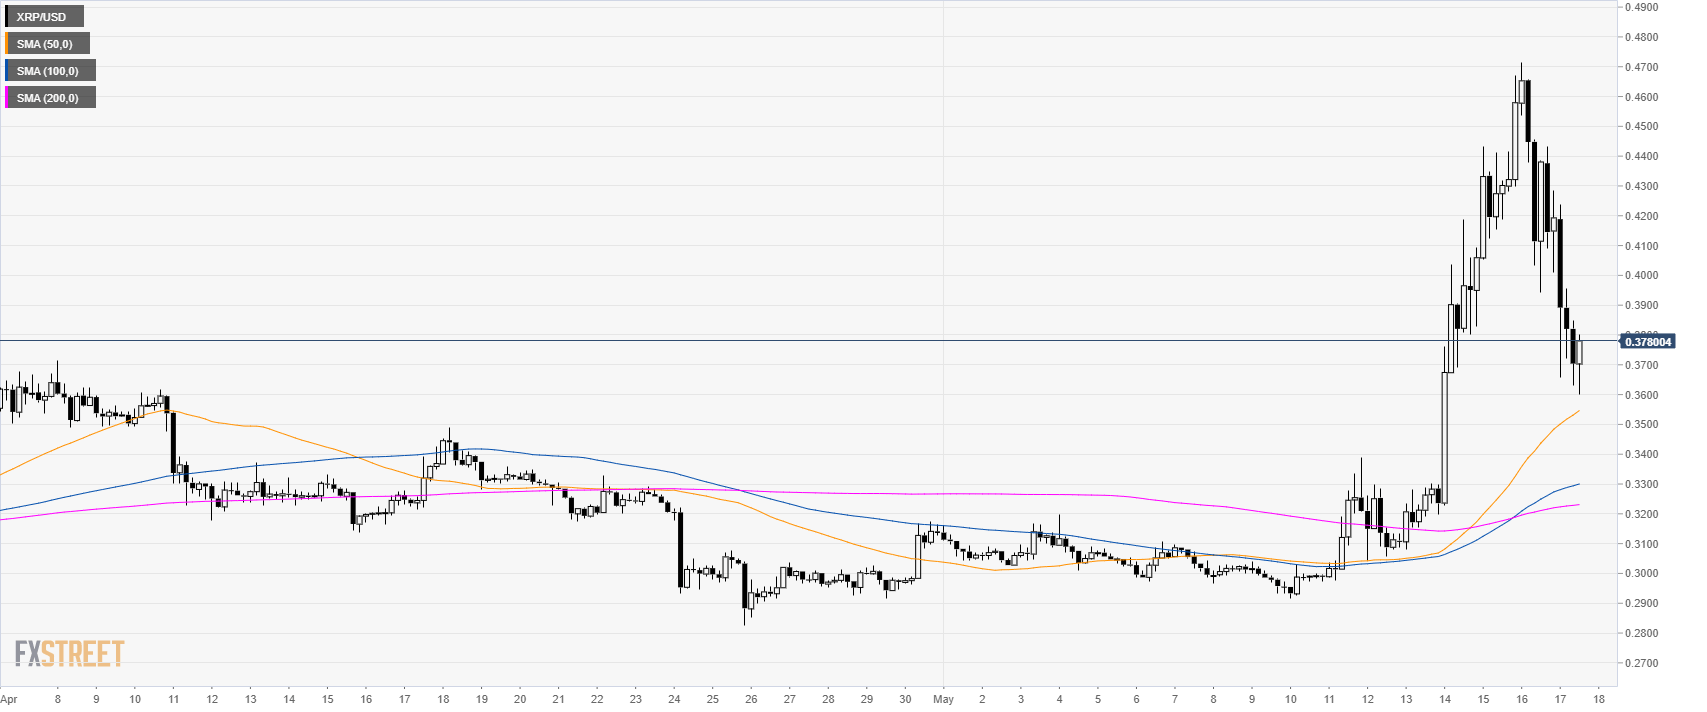
XRP/USD 4-hour chart
XRP/USD is in consolidation mode above its main simple moving averages (SMAs).
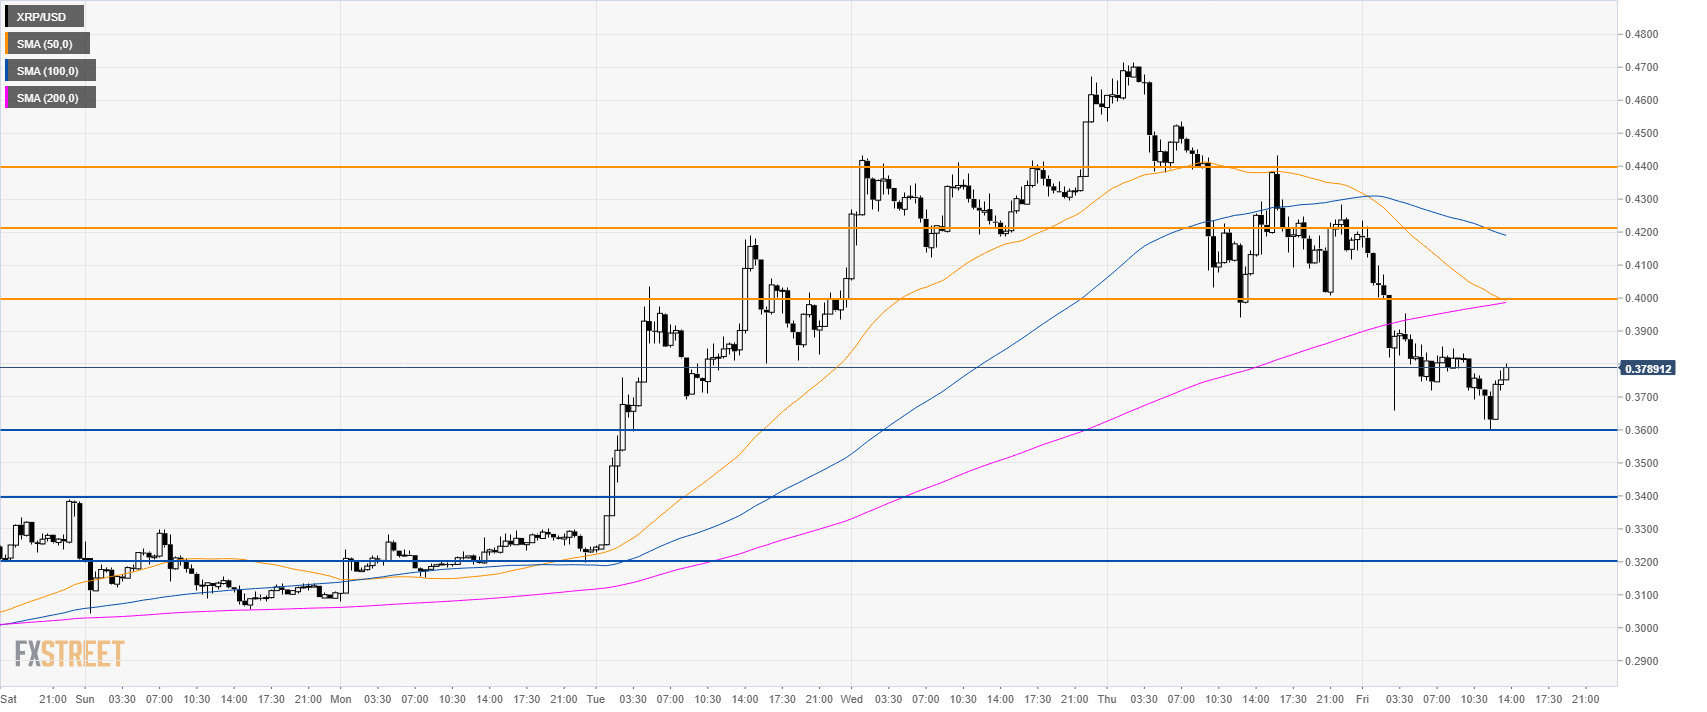
XRP/USD 30-minute chart
Ripple is trading below its main SMAs suggesting a bearish bias in the short term. The market is seen consolidating in the 0.3600 -0.4000 range. If bears can break 0.3600 then support is seen at 0.3400 and the 0.3200 price levels. Resistance is at 0.4000, 0.4200 and the 0.4400 levels.
Additional key levels
