- Litecoin is holding losses of over 2% in the second half of Thursday.
- LTC/USD price action had broken out of a bullish flag pattern formation and since seen a retest.
Litecoin price in the second half of the session on Thursday is trading in in the red by some 2%. LTC/USD bulls did briefly manage to push the price to its highest level seen since June 2018.
LTC/USD price action in its consistency to the north is very much reminiscent of the moves higher seen back in December 2017. Not to forget this is when the price ran up to all-time-highs.
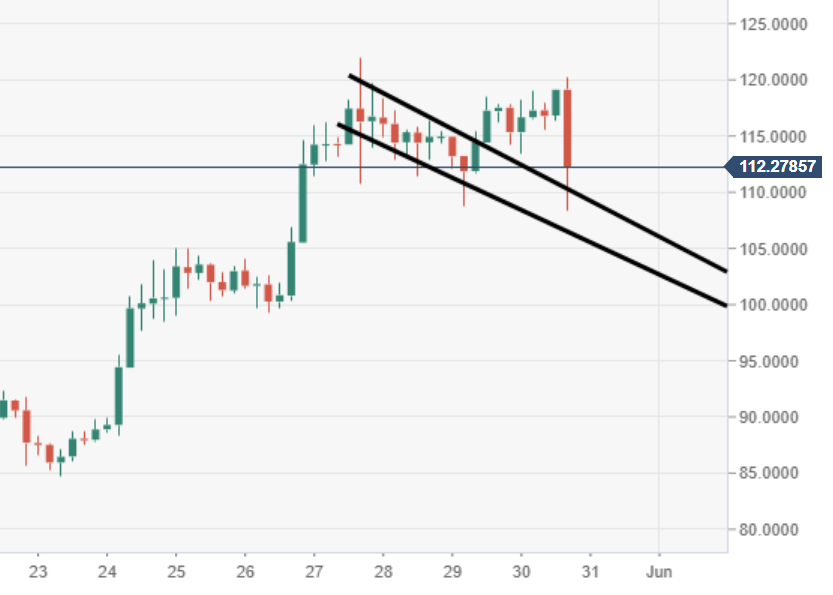
The price via the 4-hour chart view was moving within a bullish flag structure but has since seen a breakout and retest. A potential extended move to the upside looks ever-growing. Supply is running from $115-130, a break above could open the door for $150.
LTC/USD 4-hour chart