- BTC/USD drops under $8,500, but sell-off may be limited.
- The critical support is created on approach to $8,200.
Bitcoin (BTC) dropped below $8,500 handle after an unsuccessful attempt to clear the $8,800 barrier. The first digital coin has lost over 2.5% of its value since the beginning of Monday and nearly 2% in recent 24 hours. On a weekly basis, BTC/USD is down 2.3%.
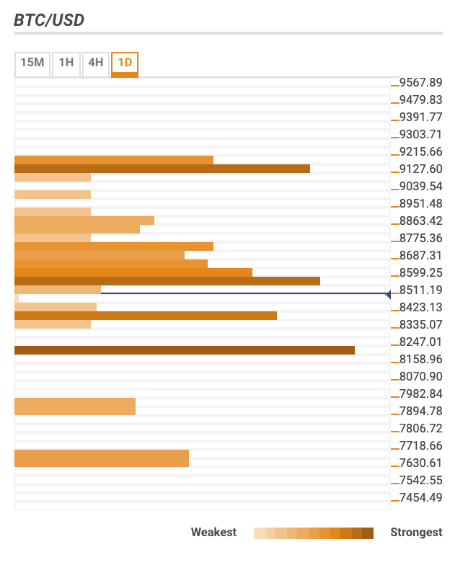
Bitcoin confluence levels
BTC/USD has a lot of barriers clustered around the current price. It means that the price may spend some time in a range before the market finds a new direction.
Resistance levels
$8,600 – a host of Simple Moving Averages (SMAs), including SMA100 1-hour, the lower line of 1-hour Bollinger Band and middle line of 4-hour Bollinger Band.
$8,750 – 38.2% Fibo retracement daily
$9,044 – the highest level of the previous week and the highest level of the previous month.
Support levels
$8,400 – 61.8% Fibo retracement weekly, 161.8% Fibo projection daily.
$8,200 – SMA100 4-hour, middle line of 1-day Bollinger Band, the lower line of 4-hour Bollinger Band, 23.6% Fibo retracement monthly.