- Bitcoin price is trading firmly in negative territory on Monday down over 3% in the second half of the session.
- BTC/USD price action via the daily chart view is moving within a rising wedge formation, subject to a potential breakout south.
- To the upside, much resistance can be observed around the $9000 price territory.
Spot rate: 8485.53
Relative change: -3.10%
High: 8742.59
Low: 8344.99
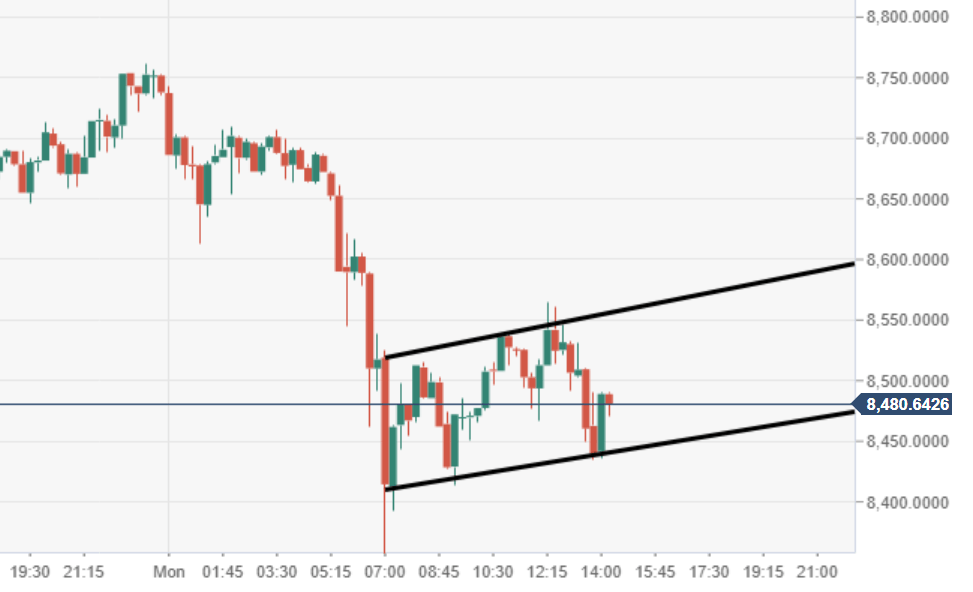
BTC/USD 15-minute chart
- A bearish flag formation can be observed via the 60-minute chart view, subject to the potential downside.
BTC/USD daily chart
- Price action via the daily chart view is moving within a rising wedge structure, subject to a potential breakout south.

