- BTC recovery is at risk as the upside momentum has faded away.
- Bulls need to engineer a strong move towards $8,300.
At the time of writing, BTC/USD is changing hands at $8,211 as the first digital coin tries to settle above the critical resistance level. A lack of follow-through bodes ill for short-term Bitcoin bulls as it might signal that the breakthrough is not sustainable.
Bitcoin is marginally higher on a day-on-day basis and unchanged since the beginning of the day. The short-term volatility is shrinking, meaning that the coin may stay range-bound in the nearest future.
Looking technically, BTC/USD hit the area above $8,300 on Thursday; however, the upside momentum faded away amid profit-taking on speculative longs. The immediate resistance is now created by the middle line of a daily Bollinger Band (currently at $8,225). It is followed by a stronger barrier at psychological $8,300 strengthened by with a confluence of several technical indicators, including the upper lines of 4-hour and 1-hour Bollinger Bands and the upper boundary of the recent consolidation channel.
A sustainable move above this handle will open up the way towards the next bullish aim of $8,500 followed by $8,900 (an upper line of weekly and daily Bollinger Bands.
On the downside, the initial support comes at $8,170 with SMA100 (Simple Moving Average) on 4-hour chart located on approach. Once it is cleared, the sell-off is likely to gain traction with the next focus on $8,100 (SMA50 1-hour). Meanwhile, a critical hurdle awaits Bitcoin bulls on approach to $8,000. This psychological barrier is strengthened by a host of technical levels, including the middle line of 4-hour Bollinger Band, SMA200 4-hour and SMA100 1-hour.
A sustainable move back below $8,000 will trigger a sharp sell-off towards $7,450 (the lower boundary of 1-day Bollinger Band) followed by $7,230 (SMA50 – Simple Moving Average – on a daily chart).
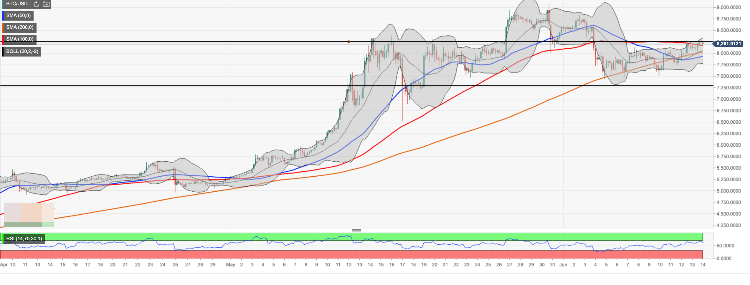
BTC/USD, 4-hour chart