- Litecoin price on Monday late in the second half of the session is trading in negative territory down some 1.25%.
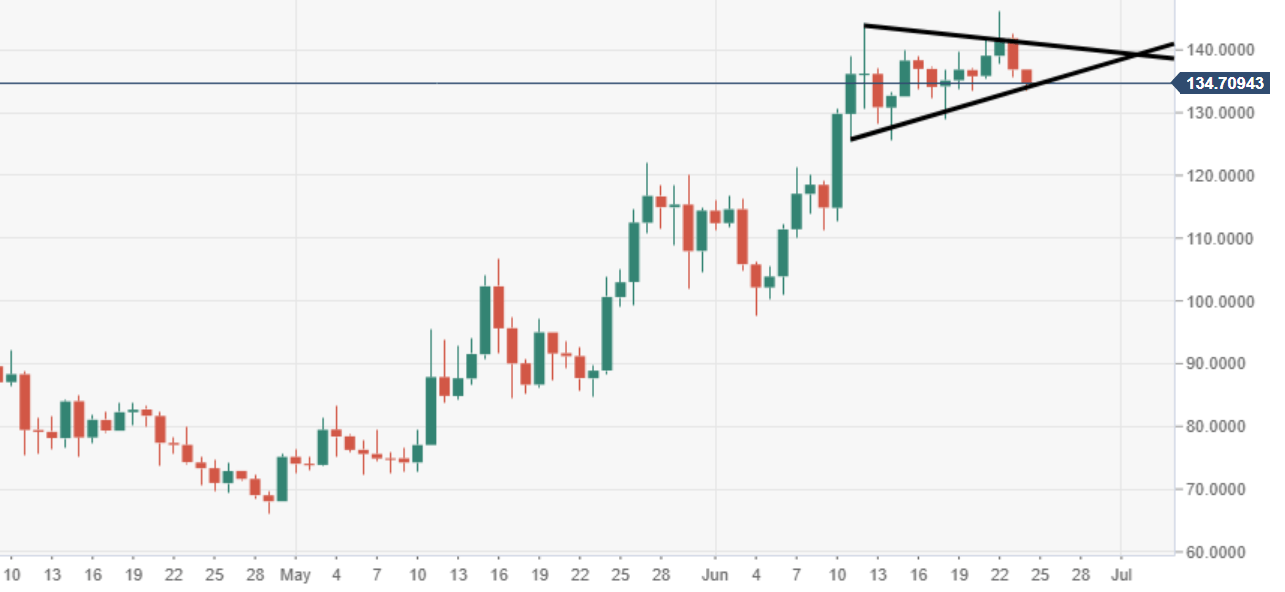
- LTC/USD bullish pennant pattern can be viewed via the daily chart.
- A wave of selling pressure was seen in the session on Sunday, after a key near-term ascending trend line break.
Spot rate:
Relative change: -0.25%
High: 136.88
Low: 133.42
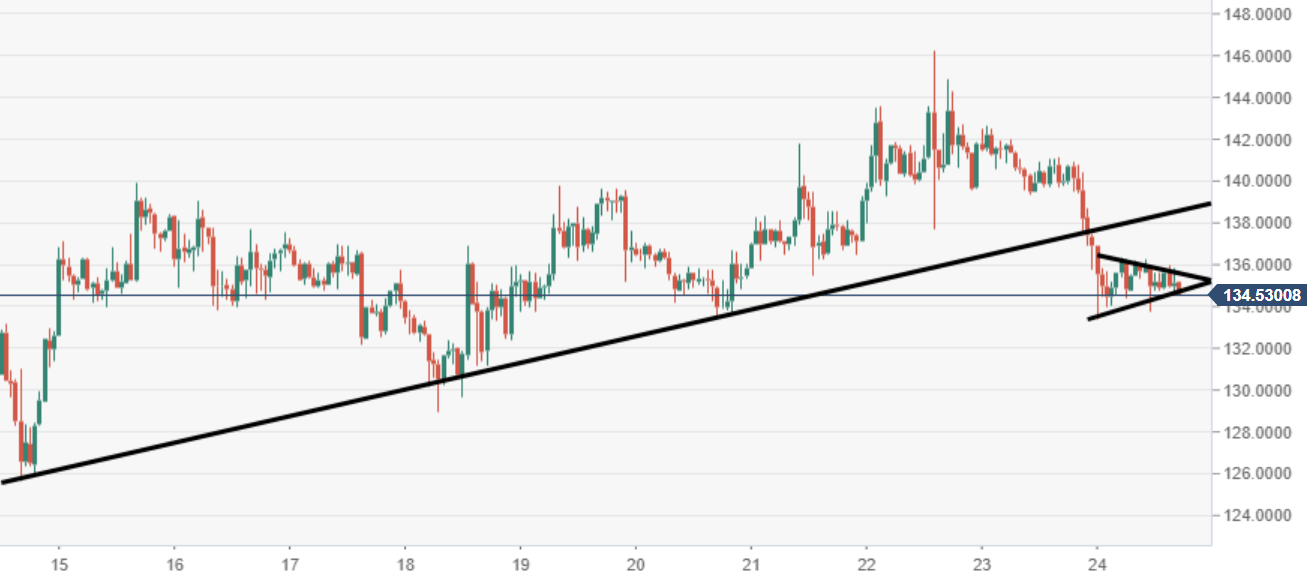
LTC/USD 60-minute chart
- The 60-minute chart view shows the price consolidating within a bearish pennant. The price may be exposed to some further downside before another push north.
LTC/USD daily chart
- Price action is moving within a bullish penannt structure, subject to a potential breakout.