- A move above $300.00 is needed to mitigate immediate bearish pressure.
- The significant support is created by the trend-line at $278.
The coin crashed from the recent high of $363.54 and hit $274.86 during early Asian hours on Friday. The second largest cryptocurrency with the current market capitalization of $31.2 has lost over 12% in recent 24 hours amid a bearish bloodbath on the global cryptocurrency market. Notably, average daily trading volumes doubled n Friday and reached $16.3 billion amid the sell-off.
Ethereum’s technical picture
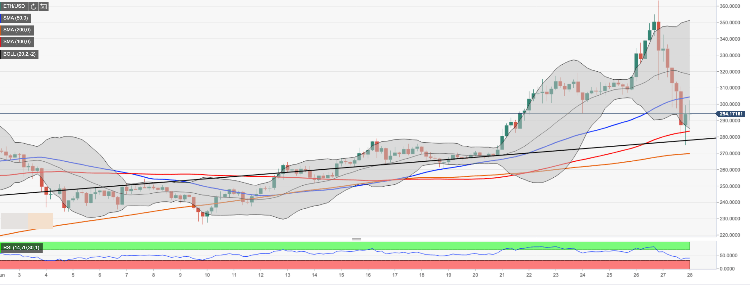
Looking technically, a sustainable move below psychological $300.00 has darkened the short-term picture. ETH/USD managed to recover from the recent low to trade at $292.50 by press time; however, the further upside is limited by the above-said $300.00 handle. This barrier is closely followed by SMA50 (Simple Moving Average) on 4-hour chart at $304.40. Once it is out of the way, the upside may gain traction with the next focus on $318.00 (the middle line of 4-hour Bollinger Band) and $320.00.
On the downside, the critical support is created by a confluence of the lower line of 4-hour Bollinger Band and SMA100 located at $284.00. If it is broken, the sell-off may continue to the previous upside trend-line at $278 and the recent low of $274.86. That’s where fresh buying interest is likely to appear and push the price back towards $300.
The Relative Strength Index (RSI) is also reversing to the North, which may be interpreted as a bullish signal.
ETH/USD, 4-hour chart