- Bulls are attempting a comeback even though overall market sentiment remains bearish.
- The daily market is sandwiched between the 20-day simple moving average (SMA 20) and SMA 50 curves.
LTC/USD daily chart
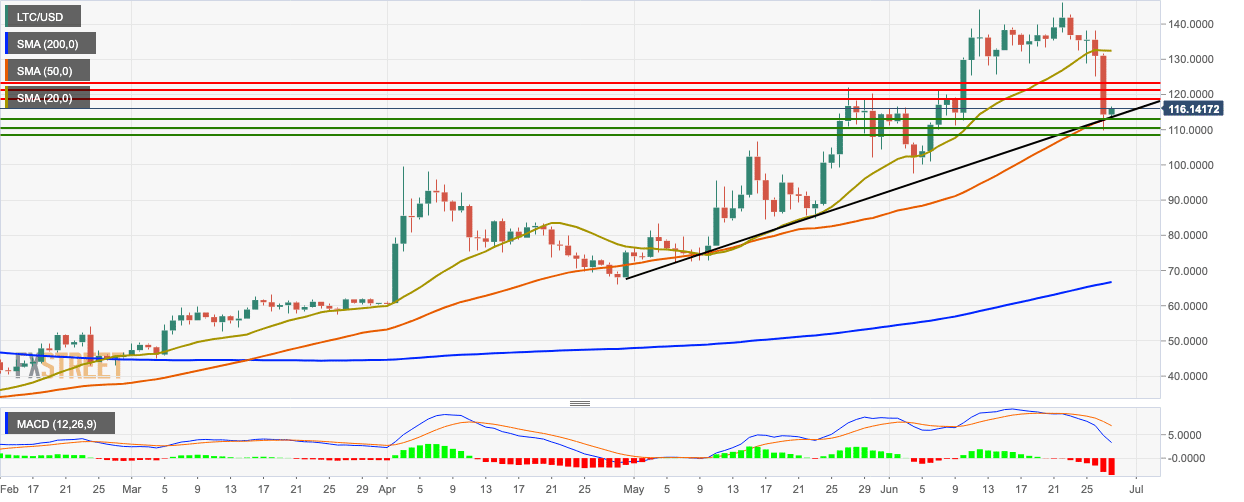
LTC/USD has gone up from $114.30 to $115.85 in the early hours of Friday following an extremely bearish Thursday. The market is sandwiched between the 20-day simple moving average (SMA 20) and SMA 50 curves while it is trending comfortably above the SMA 200 curve. The market found support on the SMA 50 and the upward trending line. The moving average convergence/divergence (MACD) indicator shows nine straight bearish sessions of increasing intensity.
LTC/USD 4-hour chart
-636972822880737215.png)
The 4-hour market has found support on the $114.45 level and is trending below the SMA 200, SMA 50 and SMA 20 curves. The SMA 50 has crossed over the SMA 20 curve, which is a bearish sign. Within the same time frame, the market had a bearish breakout from the red Ichimoku cloud. The Elliot oscillator has had nine straight bearish sessions of increasing intensity.
LTC/USD hourly chart
-636972822615419390.png)
The LTC/USD hourly market is currently trending in the downward channel formation and below the SMA 200, SMA 50 and SMA 20 curves. The SMA 50 curve and the $116.45 line acts as the immediate resistance levels which the bulls need to overcome. The relative strength index (RSI) indicator is trending around 42.15, right next to the oversold zone.
Key Levels
