- XRP/USD stuck in a range between the support at $0.3856 and the resistance at the 38.2% Fib retracement level.
- Ripple path of least resistance is sideways above the key $0.3856 support.
The slight recovery following the dips on Tuesday appears to have been a bear trap. Moreover, since the drop on Thursday last week, XRP/USD has been stuck in a range between the support at $0.3856 and the resistance at the 38.2% Fib retracement level taken between the previous drop from $0.49.41 to a low of $0.3942.
There have been attempts to recover from the dips, however, the upside remains to be capped below $0.43. Initial resistance is felt at the 23.6% Fib level at $0.41 while the second resistance lies with the 38.2% Fib level at $0.4269. The descending trendline is also capping limiting gains in addition to the resistance from both the 50 Simple Moving Average (SMA) and the 100 SMA 1-h.
Also read: Binance introducing 20x leverage for Bitcoin futures: Bitcoin rebounds above $10,000
Meanwhile, XRP is trading at $0.3942 after a 2.95% loss on the day. According to technical analysis, the price is likely to move sideways. The Relative Strength Index (RSI) at 44 is horizontal after failing to sustain growth above 60.00 and towards the overbought.
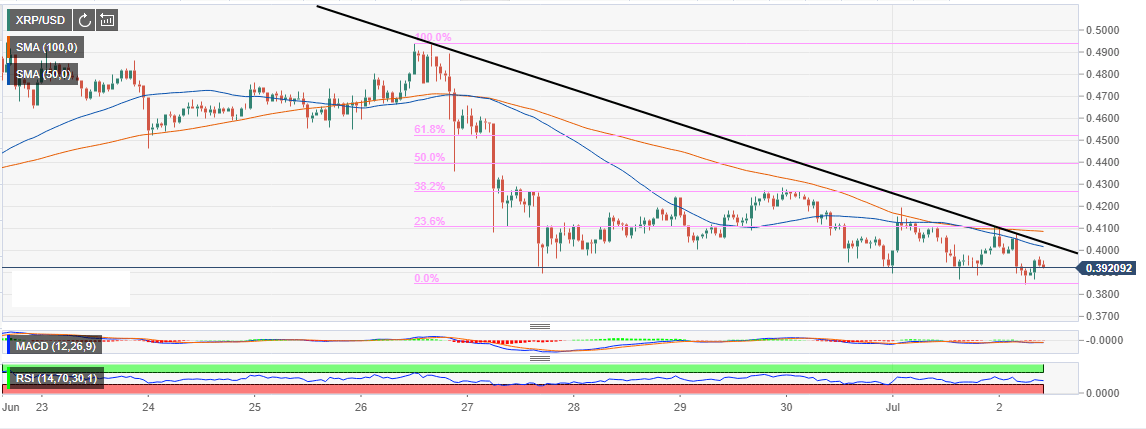
The same ranging trend is also visible with the Moving Average Convergence Divergence (MACD) which is moving sideways slightly below the mean line (0.1). With zero divergences either side, we are like Ripple could continue trading within the above-mentioned range.
XRP/USD 1-hour chart