- BTC/USD consolidates above $12,000, the upside is the path of least resistance.
- The strong support awaits BTC bulls on approach to $11,200.
Bitcoin (BTC) has rushed outside the range and settled well above $12,000; however, bulls are losing their power on approach to the next critical resistance. Agueably, we will have to spend some time consolidating gains before another bullish wave.
Bitcoin confluence levels
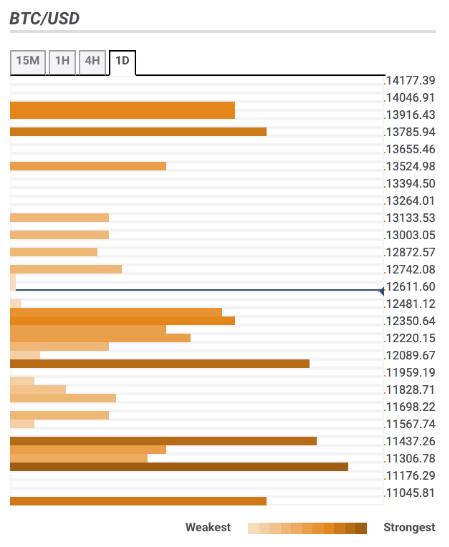
At the time of writing, BTC/USD is changing hands at $12,556, having gained over 10% on a day-on-day basis. While the coin stopped on approach to the next resistance, the further upside looks more likely as there are many strong technical levels clustered below the current price. Let’s have a closer look at the barriers that might influence Bitcoin’s movements in the short run.
Resistance levels
$13,000 – the upper line of Bollinger Band on a daily chart;
$13,500 – Pivot Point 1-week Resistance 2;
$13,750 – 161.8% Fibo projection weekly.
Support levels
$12,400 – the upper line of 1-hour Bollinger Band, SMA50 9 (Simple Moving Average) on 15-min chart;
$12,000 – 38.2% Fibo retracement daily, SMA10 daily;
$11,400 – 38.2% Fibo retracement monthly, SMA100 1-hour, SMA10 4-hour;
$11,200 – SMA200 1-hour, SMA50 4-hour, 61.8% Fibo retracement weekly