- BCH/USD is currently trading around $308 in the early hours of Saturday.
- The relative strength index (RSI) indicator is trending around 39, right next to the oversold zone.
BCH/USD daily chart
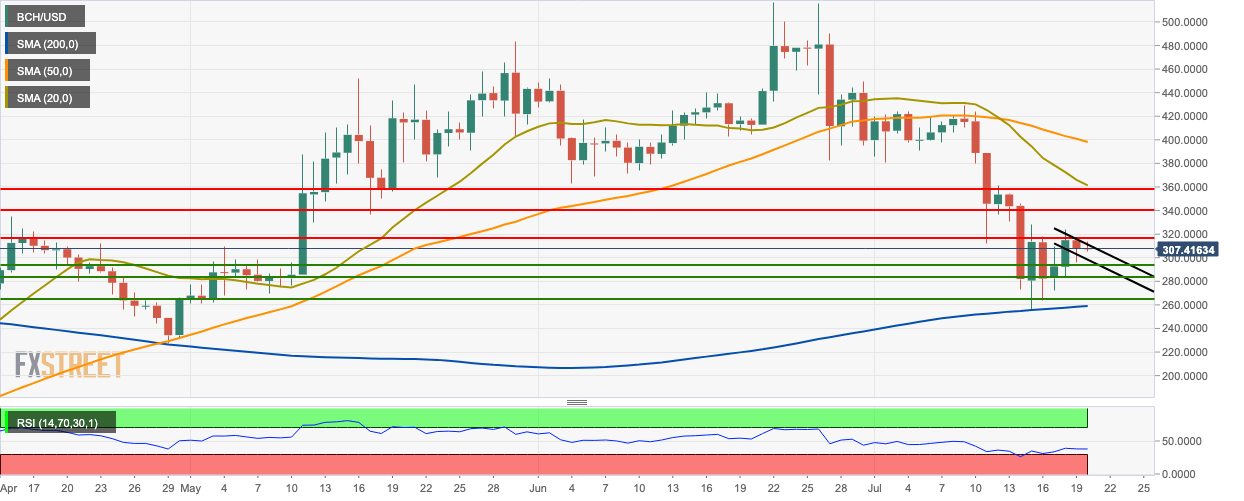
BCH/USD went down from $315.15 to $307.50 this Friday as bears took control of the market following two straight bullish days. BCH/USD managed to have a bullish start to the day as the price has gone up to $308. The daily price is trending below the 50-day simple moving average (SMA 50) and SMA 20 curves while it is above the SMA 200 curve. The relative strength index (RSI) indicator is trending around 39, right next to the oversold zone.
BCH/USD 4-hour chart
-636991866940771466.png)
The 4-hour BCH/USD market is trending below the green Ichimoku cloud. The market sentiment will soon turn bearish as per the Ichimoku cloud. The 4-hour price chart sees significant resistance at $315.75 and finds support at $301.85. The moving average convergence/divergence (MACD) indicator shows sustained bullish momentum.
BCH/USD hourly chart
-636991865902952419.png)
The hourly price chart is trending in the upper half of the 20-day Bollinger band and below the SMA 200 curve. The narrowing of the Bollinger jaw indicates decreasing market volatility. The Elliot oscillator shows six straight bullish sessions of increasing intensity.
Key Levels
