- Bitcoin’s upside momentum is gaining traction.
- The next critical barrier of $12,000 is within reach now.
BTC/USD has broken above $11,000 and has been moving towards the next important barrier of $12,000 on Monday. The first digital asset has gained over 10% in recent 24 hours, while its market share increased to 68.0% for the first time since the beginning of April 2017. While the coin is overbought on the intraday charts, there are no signals of reversal as of yet.
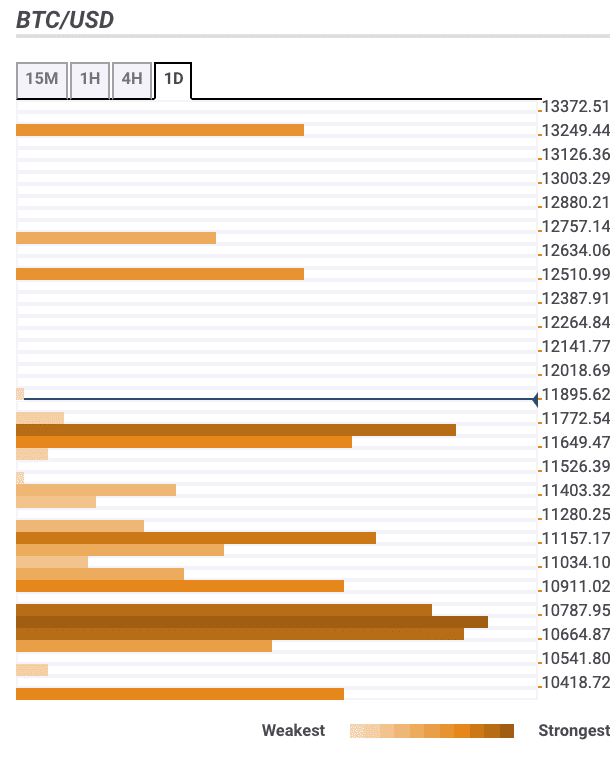
Bitcoin confluence levels
There is not much in terms of technical barriers above the current price. The trip to the North looks like the path of least resistance. Some strong support zones below the current price imply that the potential downside correction may be limited.
Let’s have a closer look at the barriers that might influence Bitcoin’s movements in the short run.
Resistance levels
$12,500 – Pivot Point 1-month Resistance 1;
$12,650 – Pivot Point 1-week Resistance 3;
$13,250 – The highest level of the previous month.
Support levels
Pivot Point 1-week Resistance 2, Pivot Point 1-day Resistance 3;
$11,150 – the middle line of 1-hour Bollinger Band, the upper line of 1-day Bollinger Band, Pivot Point 1-week Resistance 1.
$10,800-$10.600 – the middle line of 4-hour Bollinger Band, SMA200 (Simple Moving Average) 4-hour, 61.8% Fibo retracement daily, SMA50 daily, SMA100 1-hour, 38.2% Fibo retracement monthly.