- XRP/USD has a bearish bias in the long-term.
- The RSI is battling to enter the overbought after maintaining a gradual slope from the lows on July 17.
XRP/USD daily chart
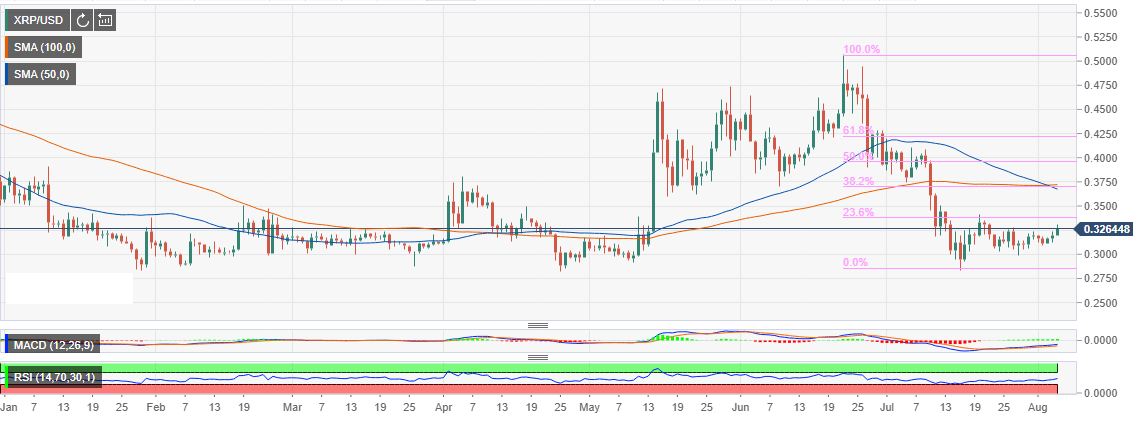
Ripple price action over the weekend was bold and impressive. The third-largest cryptocurrency market doubled down on the support at $0.30. This ensured that the only way is up which revived the trading towards $0.33 resistance. The price hit an absolute ceiling at $0.3313 while the next resistance target at the 23.6% Fib retracement level taken between the last swing low at $0.50 to a low at $0.2837 is still untested.
Significantly, the trend as shown by the daily chart shows XRP/USD having a bearish bias in the long-term. Moreover, the 50-day Simple Moving Average (SMA) has crossed below the 100-day SMA suggesting a lower consolidation level.
XRP/USD 4-hour chart
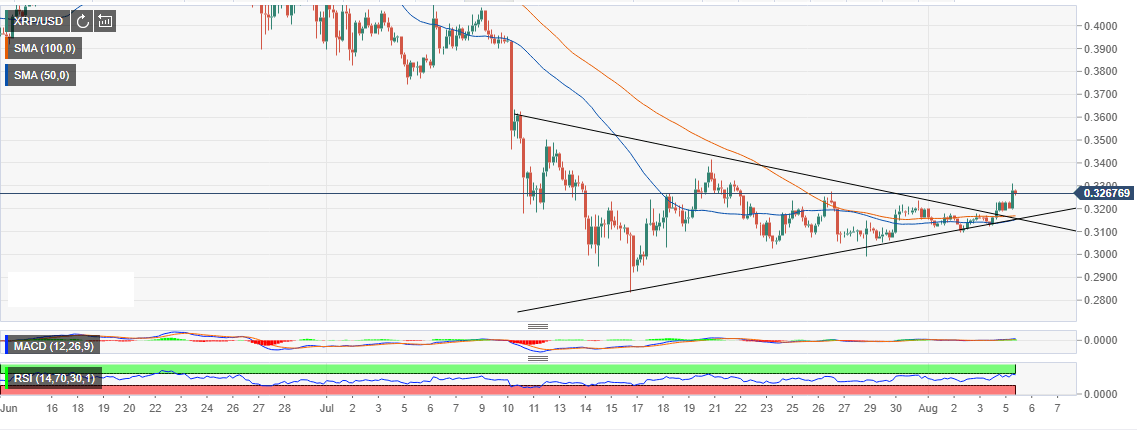
The 4-hour chart shows Ripple price come out of the symmetrical triangle pattern. As mentioned above $0.33 remains unconquered although tested. Other technical indicators like the Relative Strength Index (RSI) and the Moving Average Convergence Divergence (MACD) have formidable bullish signals.
The RSI is battling to enter the overbought after maintaining a gradual slope from the lows on July 17 at 30.00. The MACD is holding ground above the mean-line. The visible divergence points towards growing buying power.
