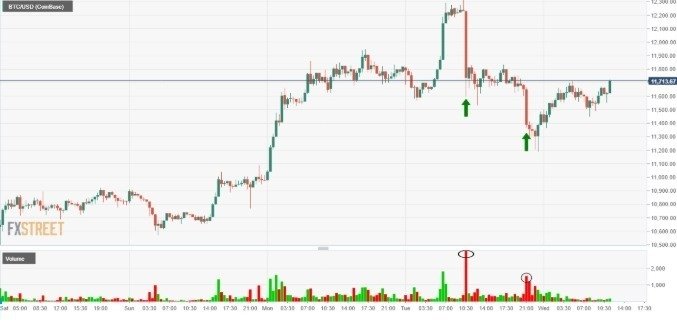
Looking at the 30-minute chart on the Coinbase exchange, there have been some massive volume spikes during the recent rally from 10,600 to 12,300. On the charts, I have marked areas in circles where selling has occurred in larger than normal volume. That is not to say that the price will not rally from here. As you can see in more recent price action the auction has taken prices higher on much thinner volume but it has to be noted at what price big sellers come in with large volumes. At the time of writing on this 30-minute chart, the BTC/USD price is breaking the previous wave high of 11,712.
On the daily chart, the 12,320 high of Tuesday’s candle is the level to break for bullishness to continue. This price action could just have been a “dead cat bounce” due to profit-taking in the recent rally. There is also a theory that when the price starts to push higher mining from the coins becomes more popular. This is obvious but it is hard to layer in the selling when these miners want to profit take. It would be counterproductive for them to sell all at once as if they plan for their activities to be sustainable then selling in smaller chunks will keep the price more stable. Nevertheless, we are at an interesting inflection point and the selling at large volumes is an essential point to be aware of.
