- LTC/USD dips below $90.00 amid strong selling pressure.
- The initial support is created by $87.50 handle.
At the time of writing, LTC/USD is changing hands at $89.39. The coin slipped below critical $90.00 after a short-lived growth above $100.00 on August 5. The fifth-largest digital asset with the current market value of $5.6 billion has lost nearly 2% on a day-on-day basis and over 8 % on a weekly basis.
On the intraday charts, a sustainable move below psychological $90.00 bodes ill for the short-term momentum. The next support awaits us on approach to the recent low of $87.52. It is followed by $86.80 (the lower line of 4-hour Bollinger Band and the lower line of 1-day Bollinger Band). The next bearish target is created by SMA200 (Simple Moving Average) daily on approach to $81.00. Litecoin has been trading above this line since the end of February.
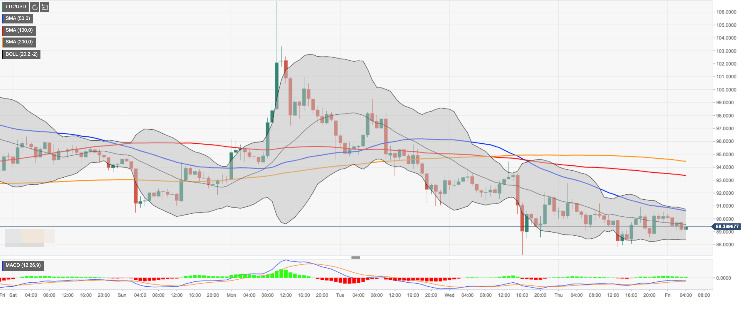
On the upside, the initial recovery is limited by $90.00, followed by with SMA50 (Simple Moving Average) and the middle line of 1-hour Bollinger Band 1-hour at $90.60. Once this area is cleared, the upside is likely to gain traction with the next focus on $93.50 ( the middle line of 1-day Bollinger Band).
LTC/USD, 1-hour chart