- BTC/USD is currently consolidating itself in a flag formation.
- BTC/USD went up from $11,875 to $11,913 as markets opened this Saturday.
Following two straight bearish days, BTC/USD has had a bullish start to Saturday. So far, BTC/USD has gone up from $11,875 to $11,913. The daily confluence shows a resistance level at $12,275, giving the bulls a clear pathway back into the $12,000-level. Three healthy support levels are currently holding up the price of BTC/USD.
BTC/USD daily confluence detector
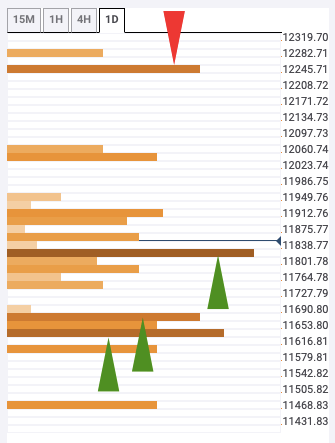
The $12,275 resistance level has the 1-day pivot point resistance 2 and 1-day Bollinger band upper curve. On the downside, there are three resistance levels at $11,825, $11,675 and $11,650. The $11,825 level has the 1-day Fibonacci 38.2% retracement level, 15-min Bollinger band lower curve, 5-day simple moving average (SMA 5), SMA 10, SMA 50 and SMA 200 curves. The $11,675 level has the 1-day previous low and 1-day pivot point support 1, while the $11,650 level has the 1-month Fibonacci 61.8% retracement level.
