-
Bitcoin price in the session on Thursday is trading in negative territory by some 0.25%.
-
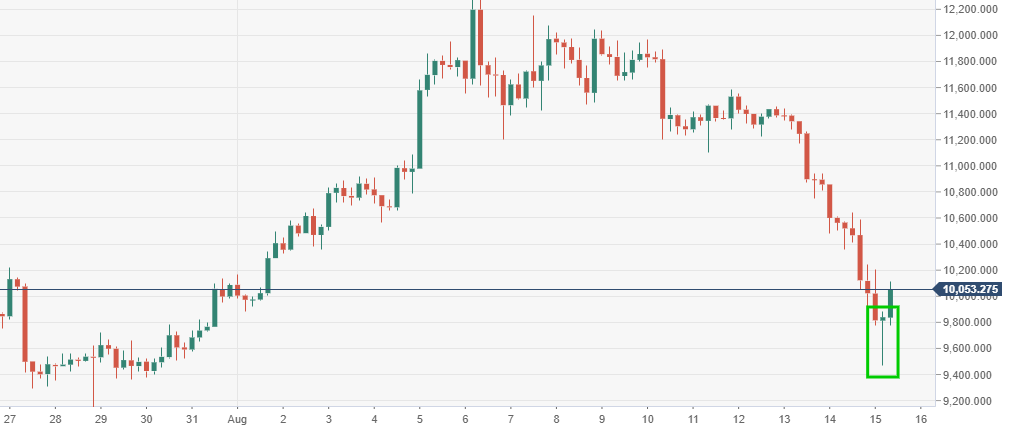
BTC/USD bears managed to force a breakout to the downside of the big psychological $10,000 mark.
-
The price has been able to catch some near-term support within a known area of demand, $10,000-9,000 price range.
Spot rate: 10,038.25
Relative change: -0,25%
High: 10,203.89
Low: 10,046.93 5
BTC/USD daily chart
-
The falling price managed to catch some support, after dipping into a known large demand zone, $10,000 down to $9,000 price range.
-637014749996010287.PNG)
BTC/USD 4-hour chart
-
Price action via the 4-hour chart view has formed a morning star/reversal doji candlestick. It suggests of a potential pullback, depending on bullish momentum.