- The SMA 20 curve has crossed over with the SMA 50 curve.
- Moving average convergence/divergence (MACD) shows a reversal of bearish momentum.
XMR/USD has gone down from $90 to $89 in the early hours of Tuesday. The bulls had taken the price up to $91.25 before the bears stepped back in and took it down to $89. This Monday, the bears took control of the market took the price down from $88 to $85, where it found support and bounced up to $90. The price is currently consolidating in a flag formation, looking to break out from the triangle pattern.
XMR/USD daily chart
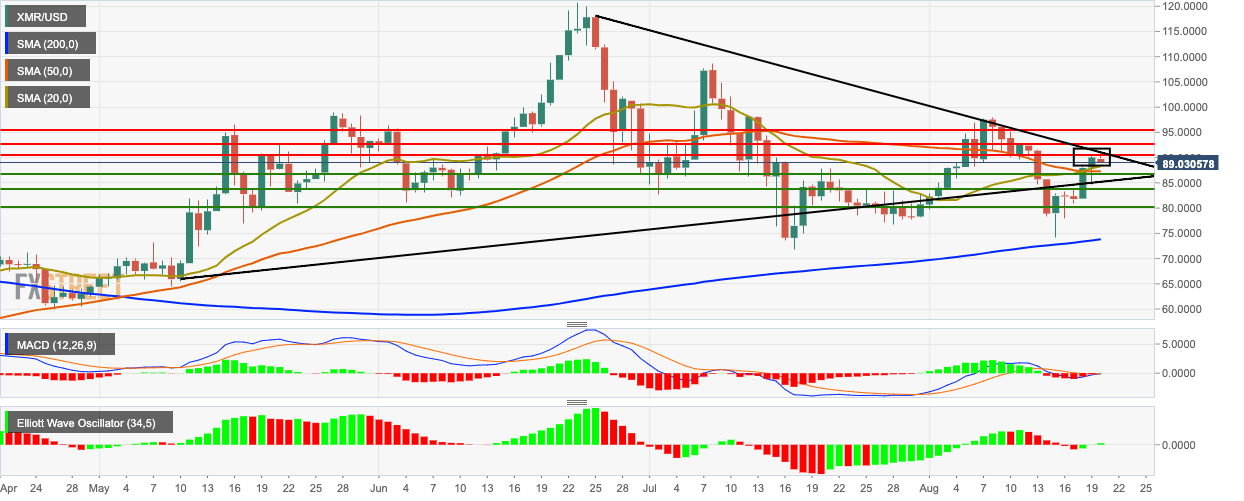
The 20-day simple moving average (SMA 20) has crossed over the SMA 50 curve, which is a bullish sign. The price is trending above both these and the SMA 200 curves. The moving average convergence/divergence (MACD) shows a reversal of bearish momentum, while the Elliot oscillator has had three straight bullish sessions of increasing intensity.
