- LTC/USD went up from $67.35 to $69.75 this Wednesday.
- The SMA 20 curve acts like immediate market resistance.
Litecoin had five bullish days in a row and went up from $67.35 to $69.75 this Wednesday. The hourly breakdown shows us that LTC/USD has been trending between $66.85 and $67.60 for the first half of Tuesday and then flew up to $69.50. The price then met resistance and went down to $68.75. The bulls then rallied together and spiked LTC/USD up to $70.70, breaking past the $70-barrier. LTC/USD ultimately corrected around $69.75.
LTC/USD daily chart
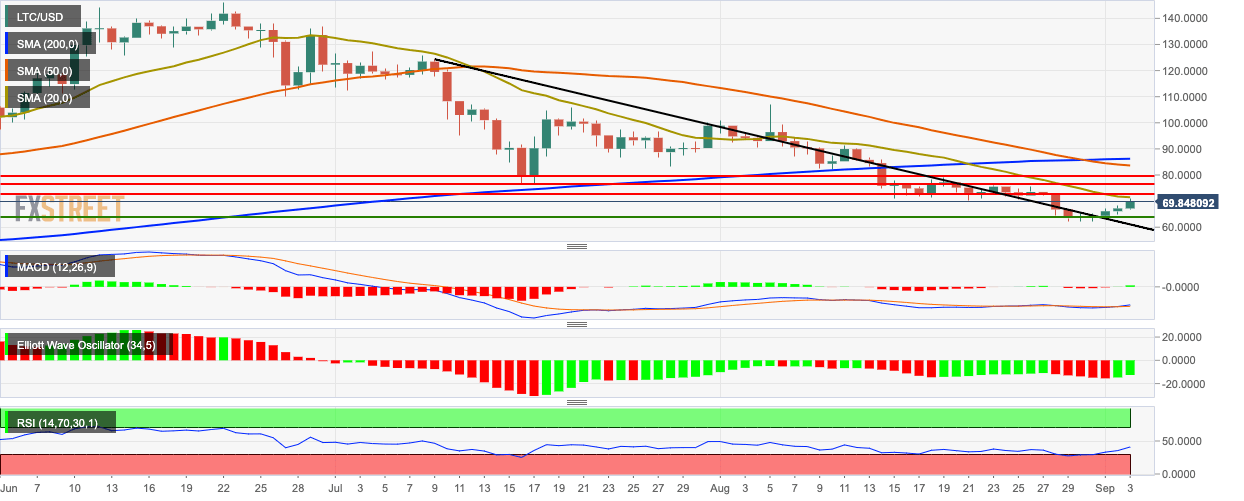
LTC/USD broke above the downward trending line and is below the 200-day simple moving average (SMA 200), SMA 50 and SMA 20 curves. The SMA 20 acts as immediate market resistance. The moving average convergence/divergence (MACD) shows increasing bullish momentum and Elliott Oscillator shows two straight bullish sessions. The relative strength index (RSI) indicator has flown up from the oversold zone and is trending around 40.60.
