- BTC/USD has had a bearish start to the day and is currently priced at $10,378.50.
- BTC/USD has one strong support on the downside.
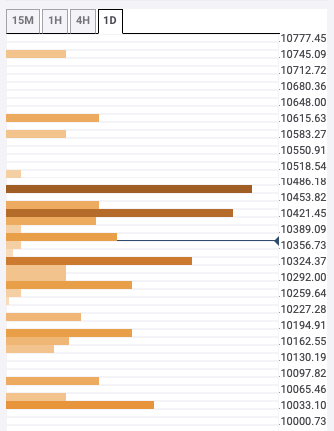
Bitcoin has had a bearish start to Friday following two bullish days in a row. BTC/USD has fallen from $10,435 to $10,378.50. The bulls ran out of steam as they failed to negotiate with the resistance at $10,500. This Thursday the price of BTC/USD spiked from $10,155 to $10,435. The hourly breakdown of Thursday shows that the bears had early control of the market, and they took the price down to $10,058. However, the bulls then stepped back in and took the price up to $10435. Currently, two resistance levels are stopping the price from re-entering the $10,500 zone. On the downside, there is a healthy support level at $10,345.
BTC/USD daily chart
The resistance levels are at $10,430 and $10,475. $10,430 has the 1-week Fibonacci 38.2% retracement level, while $10,475 has the 1-hour previous high, 4-hour previous high, 1-day previous high, 15-min Bollinger band upper curve, and the 1-month Fibonacci 38.2% retracement level.
On the downside, the $10,345 support level has the 100-day simple moving average (SMA 100), SMA 200 and 4-hour previous low.
