- Ethereum moves higher as a bout of buying volume comes in.
- The current chart pattern indicates the move will continue with the next resistance at 185.56.
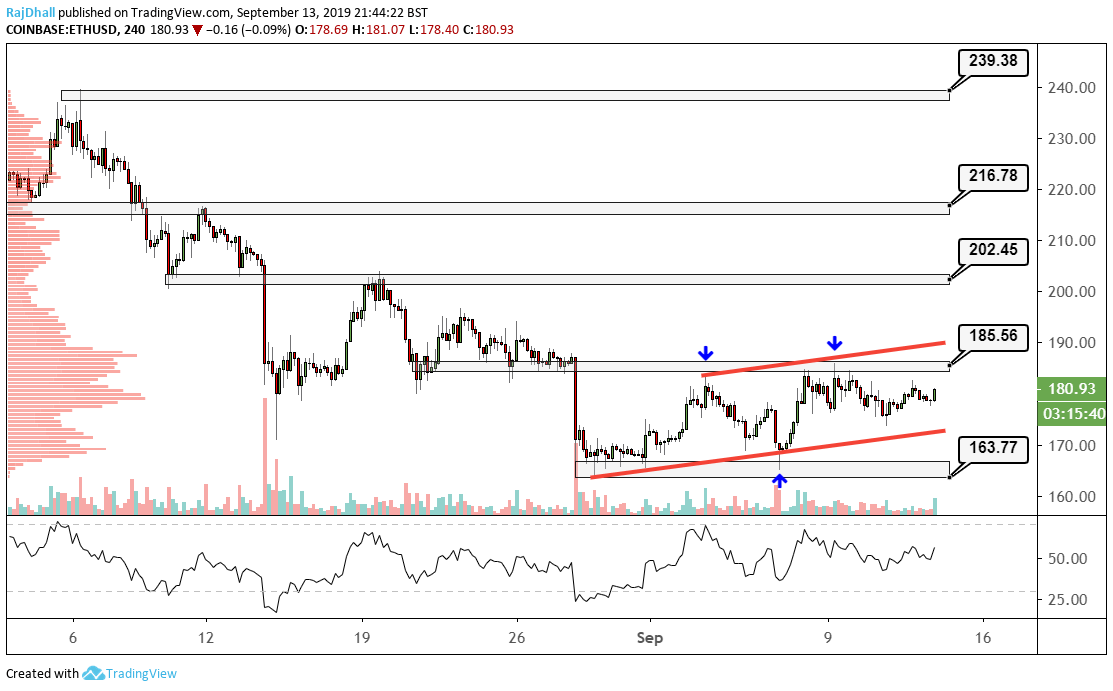
After rejecting 163 last week price has now moved away from its base formation to make a few consecutive higher lows and higher highs.
Price is moving toward the next resistance at 185.56. which was used as resistance a few times over the last month.
It has been quite the downtrend and a move from 240 to near 160 is a big drop but after this sideways move lets see if ETH/USD can move higher.
The last 4-hour candle was a hammer and indicated a move higher and we need to see how this candle closes but the momentum and volume right now look strong.
On the daily chart, the RSI is showing a hidden divergence so that is another major positive sign.